The average small business in the United States runs on a net profit margin of roughly 7% to 10%, well below the 20%+ margins many owners assume before they see their own numbers. That average hides enormous variation: a software-enabled service business can clear a 20%+ net margin in the same year a full-service restaurant often nets under 5%, purely because of how each is structured. This report breaks down how net profit margin is actually calculated, what specifically shapes it for a small business rather than a public corporation, and how it stacks up across 34 small business industries in 2026.
Net Profit Margin Equation
Every figure in this report is built on the same standard formula:
What Actually Moves the Needle for a Small Business
Most benchmark data is built on public-company financials, which doesn’t translate directly to a small business. Simply put, a small business’s margin is predominantly shaped by five specific aspects:
- Which industry it competes in
- How long it’s been operating
- How much fixed overhead it carries
- Whether it sells a product or a service
- How much of its production or delivery is automated versus done by hand
A lot of small-business benchmark data (especially figures pulled from business-for-sale platforms) reports “owner’s discretionary earnings” rather than strict net income, adding back the owner’s salary and personal expenses run through the business. That inflates the number relative to the formula above, so the breakdowns below focus on industry and business age, the two factors our data isolates directly.
Average Profit Margin for Small Business by Industry
The table below spans 34 small business industries, sorted from highest to lowest, with data collected between January and July of 2026.
| Industry | Average Net Profit Margin | Primary Cost Drivers | Margin Volatility |
|---|---|---|---|
| Independent Insurance Agencies | 20%-35% | Licensing, E&O insurance, staff labor | Low |
| Financial & Wealth Advisory | 18%-28% | Labor, compliance/licensing, office overhead | Low |
| Software / SaaS & Tech | 18%-25% | Labor, cloud hosting, R&D | Low |
| Legal Services (General Practice & Personal Injury) | 15%-25% | Attorney/staff labor, malpractice insurance, office overhead | Low |
| Mortgage Brokers | 15%-25% | Licensing, loan officer commissions, compliance | High |
| Mental Health & Counseling (Private Practice) | 15%-25% | Clinician labor, office rent, insurance billing overhead | Low |
| Medical Spas & Aesthetics | 15%-25% | Treatment products/injectables, licensed staff labor, equipment | Moderate |
| Pest Control Services | 15%-22% | Technician labor, vehicle/fuel, treatment materials | Moderate |
| Accounting & Tax Preparation | 15%-20% | Staff labor, licensing/CPE, office overhead | Low |
| Residential & Commercial Cleaning Services | 10%-20% | Labor, supplies, vehicle/equipment | Moderate |
| Dental Practices | 12%-18% | Staff labor, dental supplies/lab fees, equipment | Moderate |
| Business & Management Consulting | 12%-18% | Consultant labor, business development, office overhead | Low |
| Veterinary Clinics | 10%-16% | Staff labor, medical supplies/medications, equipment | Moderate |
| Real Estate Brokerages (Residential) | 10%-16% | Commission splits, marketing/lead generation, licensing | High |
| Architecture & Design Firms | 10%-15% | Staff labor, liability insurance, software/licensing | Moderate |
| IT Services & Managed Support (MSPs) | 10%-15% | Technical staff labor, software licensing, support infrastructure | Low |
| HVAC Contractors | 10%-15% | Equipment/parts, technician labor, vehicle fleet | Moderate |
| Property Management Companies | 10%-15% | Staff labor, software/licensing, insurance | Moderate |
| Plumbing Services | 10%-14% | Materials/parts, technician labor, vehicle fleet | Moderate |
| Electricians | 10%-14% | Materials/parts, technician labor, vehicle fleet | Moderate |
| Landscaping & Lawn Care | 8%-15% | Crew labor, equipment/fuel, seasonal staffing | High |
| Roofing Contractors | 8%-14% | Materials, skilled labor, insurance/liability | High |
| Physical Therapy Clinics | 8%-12% | Clinician labor, facility/equipment, insurance billing overhead | Moderate |
| Hair Salons & Barbershops | 8%-12% | Stylist labor/commission, supplies, rent | Moderate |
| Auto Repair Shops | 8%-12% | Parts, technician labor, shop equipment | Moderate |
| Marketing & Advertising Agencies | 6%-12% | Staff labor, media/ad spend pass-through, software tools | Moderate |
| Fast Food & Quick-Service Restaurants | 6%-9% | Food cost, labor, rent | High |
| Boutique Hotels & B&Bs | 5%-10% | Labor, property/facility costs, seasonal occupancy | High |
| Event Venues & Catering | 5%-10% | Food/beverage cost, event labor, venue overhead | High |
| E-Commerce / DTC Retail | 4%-8% | Inventory, shipping/fulfillment, digital ad spend | Moderate |
| General Contracting & Design-Build Firms | 3%-8% | Materials, subcontractor/labor costs, equipment | High |
| Coffee Shops & Cafes | 2.5%-7% | Beverage/food cost, labor, rent | High |
| Restaurants (Full-Service) | 3%-6% | Beverage/food cost, labor, rent | High |
| Specialty Food & Grocery Retail | 2%-4% | Inventory/perishables, labor, rent | Moderate |
Average Profit Margin for Small Business by Business Age & Maturity: 2026
| Business Stage | Years in Operation | Average Net Profit Margin | What Drives the Change |
|---|---|---|---|
| Startup | 0-1 | 0%-8% | Owner absorbs most labor cost; pricing and customer base are still being established |
| Early-Stage | 1-3 | 4%-9% | Learning-curve inefficiencies and cost-of-capital pressure are still working through the business |
| Growth Stage | 3-5 | 7%-12% | Repeat and referral customers start lowering acquisition cost; processes begin standardizing |
| Established | 5-10 | 10%-15% | Vendor terms are negotiated, staffing is right-sized, pricing is calibrated to real costs |
| Mature | 10+ | 12%-18% | Referral equity, depreciated equipment, and optimized staffing lower the marginal cost per sale |
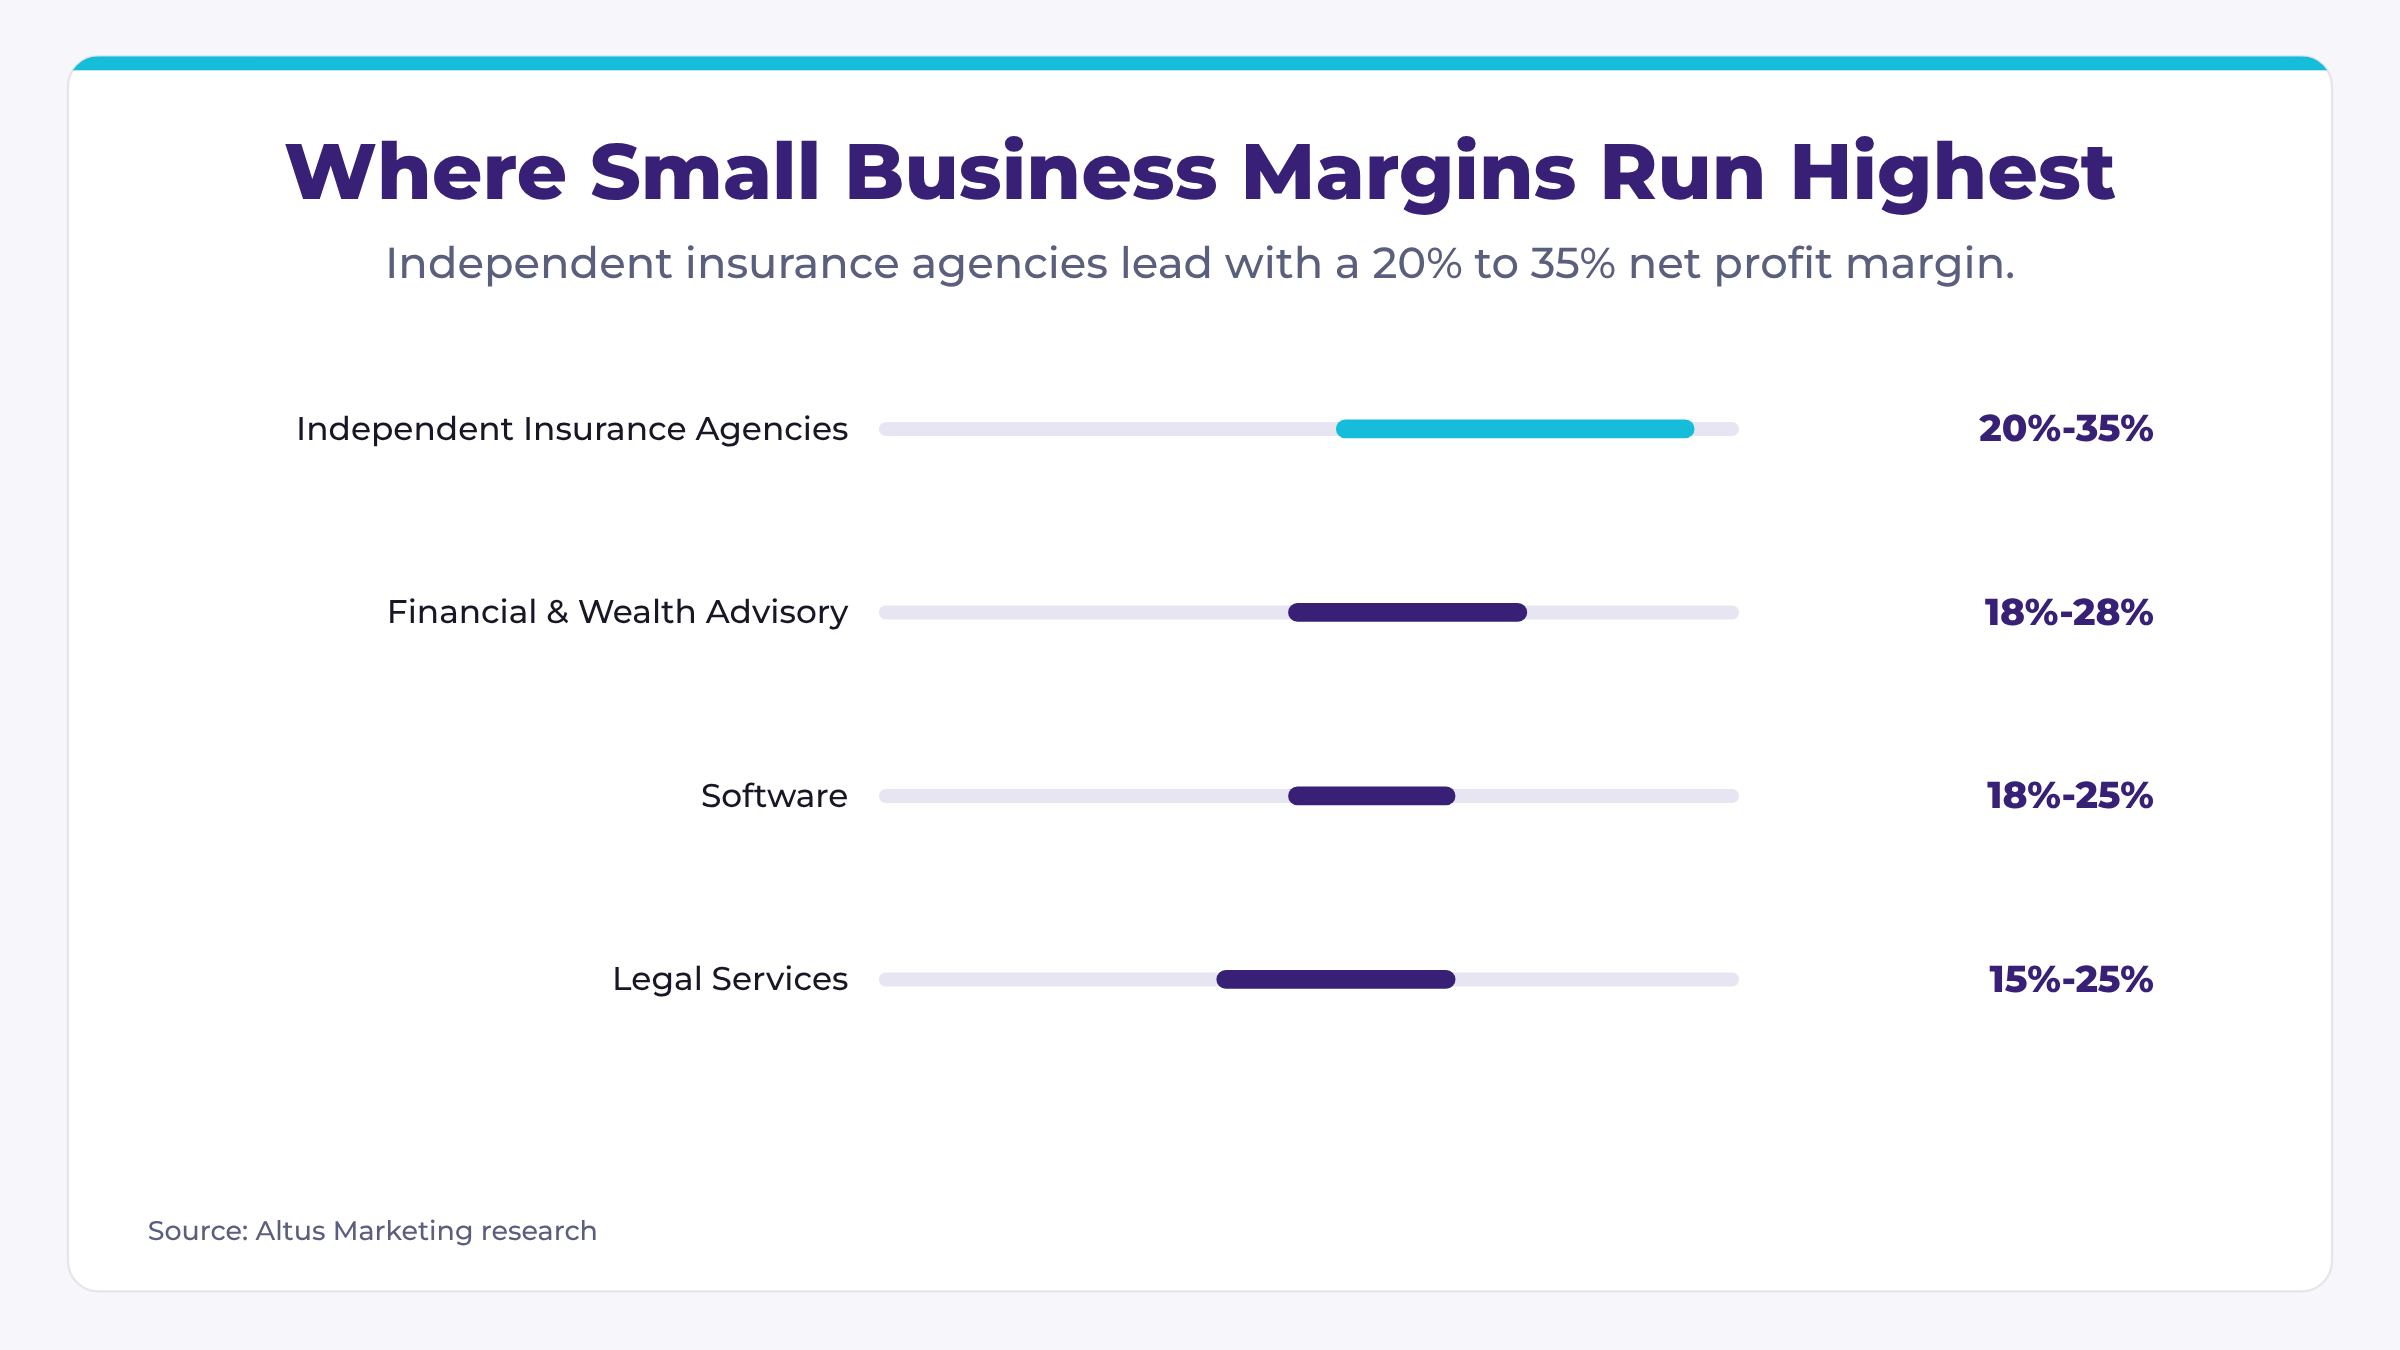
Where Small Business Margins Run Highest
| Industry | Average Net Profit Margin |
|---|---|
| Independent Insurance Agencies | 20%-35% |
| Financial & Wealth Advisory | 18%-28% |
| Software / SaaS & Tech | 18%-25% |
| Legal Services (General Practice & Personal Injury) | 15%-25% |
Where Small Business Margins Run Lowest
| Industry | Average Net Profit Margin |
|---|---|
| General Contracting & Design-Build Firms | 3%-8% |
| Coffee Shops & Cafes | 2.5%-7% |
| Restaurants (Full-Service) | 3%-6% |
| Specialty Food & Grocery Retail | 2%-4% |
What This Means for Benchmarking Your Own Margin
The overall small-business average of 7-10% is only useful as a starting point, whereas the industry-specific ranges above are the numbers actually worth measuring against.
The historical trend is worth factoring in too. Small business margins compressed from roughly 8% in 2021 to about 7.3% in 2023 as inflation and borrowing costs rose, and have only partially recovered since, with 2026 projected in the 7.8%-8.2% range (still short of the pandemic-era peak).
Within that broader trend, the businesses rising out of the gap fastest tend to share three traits: they operate in a category with genuine pricing power, they keep overhead proportional to revenue instead of scaling headcount ahead of demand, and they’ve automated at least the administrative and scheduling work that doesn’t require a person’s judgment. None of those three levers require changing industries; they’re available to a restaurant or a contractor just as much as to a consultant.
- Margins generally compress moving down this list because each category trades pricing power for physical inputs: professional and technology-driven businesses sell expertise and code, which cost little to reproduce, while food, trade, and retail businesses sell physical goods and labor-hours that are easy for a customer to comparison-shop.
- The margin generally climbs with age; not because older businesses work harder, but because pricing stabilizes and repeat business reduces the cost of winning new work.
- These categories lead for the same underlying reason: each sells expertise, an ongoing relationship, or code rather than a physical product, so there’s very little cost of goods sold standing between revenue and profit.
If you’d like to see how SEO and GEO can increase profit margins for your own business, don’t hesitate to connect with us here.
Sources
- “15+ Average Small Business Revenue + Profit Margin Statistics [2026]”. Zippia. January 14, 2026. Compiles small-business revenue and profit statistics, including the commonly cited 7-10% average net margin benchmark used in this report’s introduction. https://www.zippia.com/advice/small-business-revenue-profit-margin/
- “2026 Small Business Revenue Statistics + Tips To Boost Yours”. Vena Solutions. January 2, 2026. Small-business revenue and profitability roundup corroborating the 7-10% healthy-margin benchmark. https://www.venasolutions.com/blog/small-business-revenue-statistics
- “Average Small Business Profit Margin 2026: Industry Data”. Savannah Davis. February 16, 2026 (updated March 4, 2026). Compiled profit margin data across 143 industry sectors, including the industry-level margin figures referenced throughout this report. https://votednumberone.com/small-business-profit-margin-2026/
- “Average Profit Margins by Industry (2026), Are Yours Normal?”. TheMarginCalculator.com Research Team. Last verified May 2026. Gross and net margin benchmarks across 30+ industry sectors, sourced from and verified against NYU Stern Damodaran data; basis for most “NYU Stern-anchored” figures in this report. https://www.themargincalculator.com/margins-by-industry/
- “Margins by Sector (US)”. NYU Stern School of Business. Aswath Damodaran. Data as of January 2026. Primary academic dataset of gross and net margins by industry sector for U.S. public companies, cited as the underlying source for several industry benchmarks in this report. https://pages.stern.nyu.edu/~adamodar/New_Home_Page/datafile/margin.html
- “Small Business Study: Profitability Through a Business Lifetime”. Guidant Financial. September 23, 2019 (updated June 29, 2026). Research on how business age and years in operation correlate with reported profitability, used as the basis for the business age & maturity breakdown. https://www.guidantfinancial.com/blog/small-business-study-lifetime-profitability/
- “A Guide to Overhead Costs for Small Businesses”. SMB Compass. July 11, 2025. Overhead-ratio benchmarking guidance used as the basis for the fixed overhead discussion. https://www.smbcompass.com/an-entrepreneurs-guide-to-overhead-costs-for-small-businesses/