From January 2024 through September 2026, our research team at Altus Marketing compiled cost per lead and customer acquisition cost data across roofing contractors of varying size, market type, and service category. Our methodology applied a weighted model accounting for business size, geographic market, lead source, and service type to produce the figures below.
In the sections below, we break down roofing cost per lead and customer acquisition cost by lead source, then look at CAC by business size, CPL and CAC by market type, and CAC by service category, along with the main factors that push roofing CPL and CAC up or down.
Average Cost Per Lead for Roofing Contractors by Lead Source: 2026
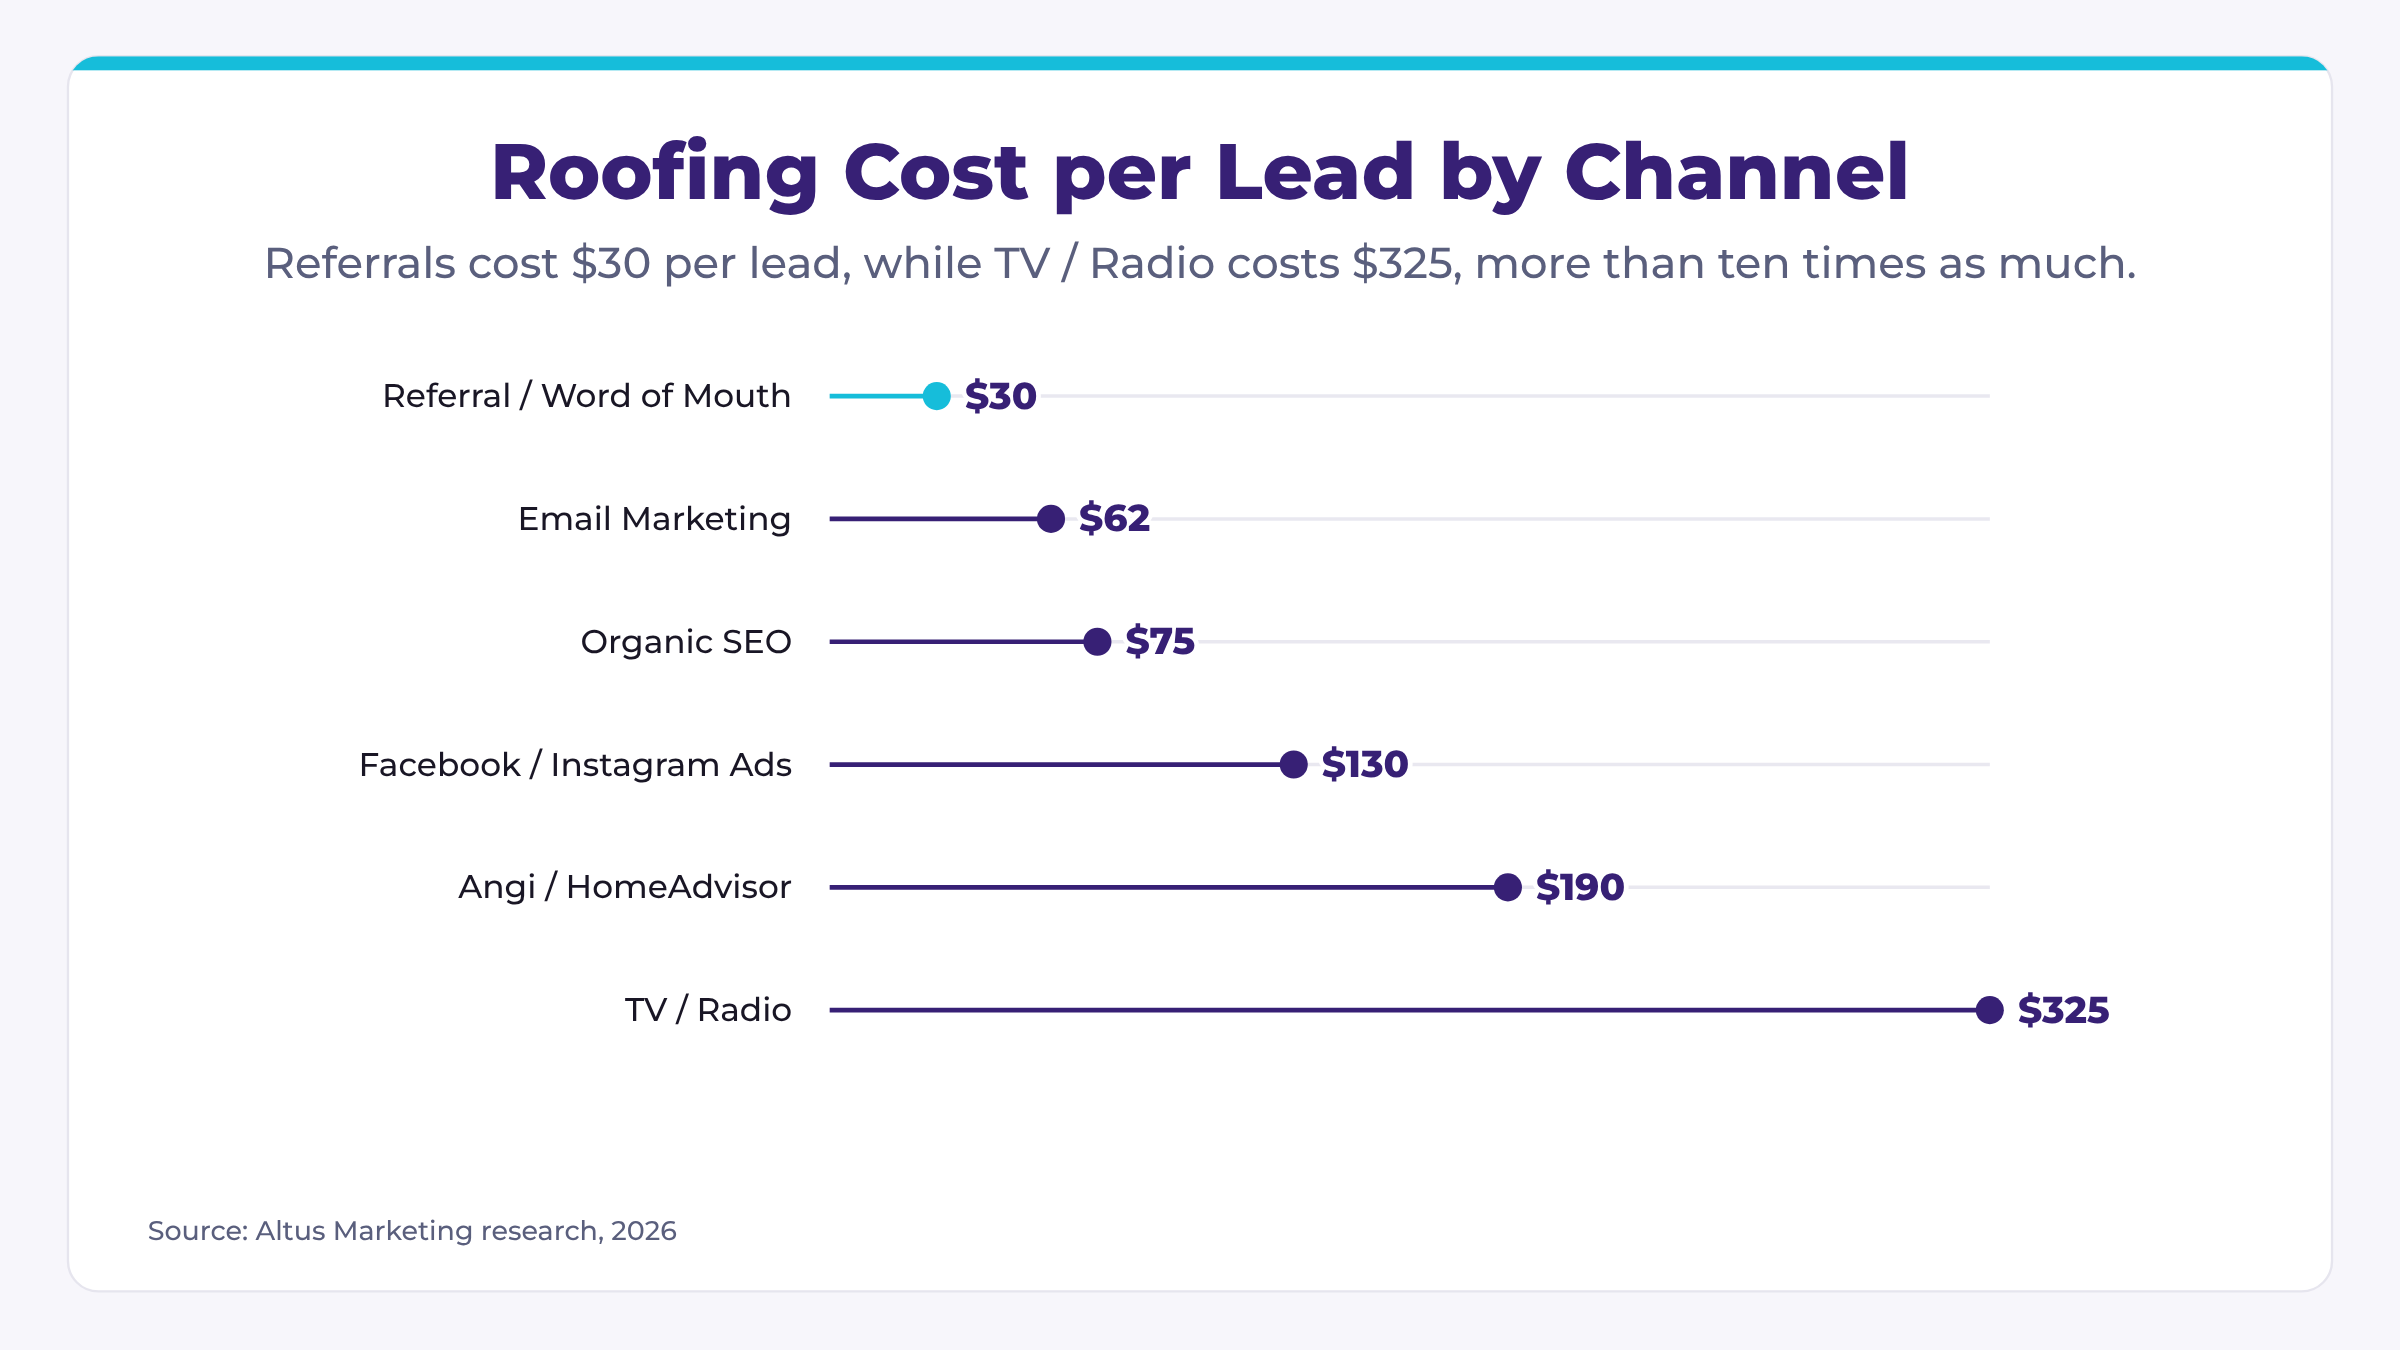
The graphic below breaks down average cost per lead by channel for roofing contractors in 2026.
- Referral / Word of Mouth produces the lowest CPL at $30, while storm-based and event-driven leads are next at $60 but are unpredictable and geographically limited
- Organic SEO delivers among the lowest sustained CPL of any channel and improves over time
- Google LSAs outperform standard PPC for most residential roofing contractors
Average Customer Acquisition Cost for Roofing Contractors by Lead Source: 2026
The graphic below breaks down average CAC by lead source, factoring in average close rates per channel for roofing contractors in 2026.
- Referral has the lowest CAC by far, but is nearly impossible to scale predictably
- Organic SEO and email marketing offer the best scalable CAC of any owned channel
- Direct mail carries both high CPL and low close rate, producing the highest CAC of any channel tracked
Average Roofing CAC by Business Size: 2026
The table below breaks down average CAC by roofing contractor size and team structure in 2026.
| Business Size | Monthly Spend | Monthly Leads | Close Rate | Avg. CAC |
|---|---|---|---|---|
| Solo / Owner-Operator | $500-$2,000 | 5-15 | 35% | $400-$700 |
| Small (2-5 crews) | $2,000-$6,000 | 15-40 | 40% | $300-$550 |
| Mid-Size (6-15 crews) | $6,000-$15,000 | 45-100 | 48% | $200-$400 |
| Large (16-40 crews) | $15,000-$40,000 | 110-275 | 55% | $150-$300 |
| Enterprise (40+ crews) | $40,000+ | 300+ | 60% | $100-$200 |
- Roofing CAC drops sharply as business size increases, driven by brand recognition and faster response infrastructure
- Solo operators face the steepest CAC-to-revenue challenge, especially in competitive metro markets
- Mid-size contractors see the most meaningful improvement from SEO investment relative to cost
- Enterprise contractors leverage brand authority to close leads at about 1.7 times the rate of solo operators (60% versus 35%)
Average Roofing CPL and CAC by Market Type: 2026
The graphic below breaks down average CAC by geographic market type for roofing contractors in 2026.
- CAC rises steadily with market size, from $200-$400 in rural markets to $600-$1,200 in major metros
- Storm corridor markets offer the lowest CAC at $150-$350, but depend on unpredictable weather events
- Major metro markets carry the highest CAC of any market type at $600-$1,200
- Rural markets have a relatively low CAC at $200-$400 but limited volume, which constrains growth potential for multi-crew operations
Average Roofing CAC by Service Category: 2026
The table below breaks down average CAC, average job value, and average sales cycle by roofing service category in 2026.
| Service Category | Avg. CAC | Avg. Job Value | Avg. Sales Cycle | Avg. Close Rate |
|---|---|---|---|---|
| Residential Roof Replacement | $300-$600 | $8,000-$20,000 | 3-10 days | 40-55% |
| Residential Roof Repair | $100-$250 | $500-$3,000 | Same day-2 days | 55-70% |
| Storm Damage / Insurance Claims | $150-$400 | $10,000-$30,000 | 1-3 weeks | 50-65% |
| Commercial Flat Roof | $400-$900 | $15,000-$150,000+ | 2-8 weeks | 30-45% |
| Roof Inspection | $50-$150 | $150-$400 | Same day | 65-80% |
| New Construction Roofing | $250-$550 | $12,000-$50,000 | 4-12 weeks | 35-50% |
| Metal Roofing | $350-$700 | $12,000-$35,000 | 1-3 weeks | 35-50% |
| TPO / EPDM Commercial | $450-$950 | $20,000-$200,000+ | 3-10 weeks | 25-40% |
- Roof inspections have the lowest CAC and highest close rates but generate limited direct revenue
- Storm damage and insurance claim work offers among the best CAC-to-job-value ratios of any category
- Commercial flat roof and TPO/EPDM work carries high CAC but the longest customer relationships and largest contracts
- Residential repair has a low CAC and fast sales cycle, making it an efficient volume driver for mixed-revenue operations
What Drives Roofing CPL and CAC Up or Down?
Several factors consistently separate roofing contractors with a blended CAC under $300 from those spending $800 or more per customer.
Lead source mix is the most direct lever. Roofing contractors who rely heavily on paid lead aggregators compete for the same leads against multiple contractors simultaneously, driving CPL up and close rates down. Contractors who invest in owned channels like organic SEO and email marketing build lead flows that compound over time and produce significantly lower CAC.
Close rate by channel varies dramatically in roofing and is often ignored. A contractor paying $175 per lead on a channel with a 55% close rate has a CAC of about $318. That same $175 CPL on a 20% close rate channel produces a CAC of $875. Tracking close rate by source, not just lead volume, is the most direct path to understanding true CAC.
Storm season timing creates natural volatility in both CPL and CAC. After a major hail or wind event, lead volume spikes and CPL often drops due to demand surge. Contractors who have existing SEO presence and Google Business Profile authority tend to capture the highest share of this demand at the lowest cost.
Response time affects close rates more in roofing than in almost any other home services vertical. Homeowners dealing with storm damage or an active leak are choosing whoever responds first. A contractor who calls within five minutes of a web form submission closes at dramatically higher rates than one who follows up the next day.
Seasonality affects roofing contractors more than most trades. Q2 and Q3 (spring and summer) represent peak demand in most markets. Contractors who invest in SEO and brand-building during slow winter months are better positioned to capture high-volume demand when the season turns.
To download a copy of this report or get in contact with our team, please reach out here: Contact Altus Marketing.
Sources
- Roofing Contractor Cost Per Lead and Customer Acquisition Cost Analysis
Author: Altus Marketing Research Team
Publication: Altus Marketing
Date: October 2026
URL: https://altusmarketing.co/blog/roofing-cpl-and-cac/ - Local Services Ads
Author: Google
Publication: Google Ads
Date: 2026
URL: https://ads.google.com/local-services-ads/ - How Much Does Roof Replacement Cost?
Author: HomeAdvisor
Publication: HomeAdvisor
Date: 2026
URL: https://www.homeadvisor.com/cost/roofing/install-a-roof/ - Local Consumer Review Survey 2026
Author: BrightLocal
Publication: BrightLocal
Date: 2026
URL: https://www.brightlocal.com/Research/Local-Consumer-Review-Survey/ - Google Ads Benchmarks 2026
Author: WordStream
Publication: WordStream
Date: 2026
URL: https://www.wordstream.com/blog/2026-google-ads-benchmarks - Facts + Statistics: Homeowners and Renters Insurance
Author: Insurance Information Institute
Publication: III
Date: 2026
URL: https://www.iii.org/fact-statistic/facts-statistics-homeowners-and-renters-insurance