From April through September 2026, our research team built a weighted acquisition model anchored to 2025 and 2026 residential cleaning industry benchmarks, drawing on published ad account benchmarks, booking data, and operator surveys across the major lead channels. Because house cleaning runs on recurring revenue, acquisition cost in this piece is measured against the first signed recurring engagement, which is a different yardstick from a one-time or first-visit booking.
Our analysis found that the national average recurring client acquisition cost for residential cleaning companies is $155 in 2026. In the sections below, we break down recurring CAC by state, lead source, service frequency, business size, and market type.
Average House Cleaning Recurring Client CAC by State: 2026
The table below breaks down the average cost for a residential cleaning company to sign one recurring client in each of the 50 states, along with how each state compares to the $155 U.S. average.
| State | Avg. Recurring CAC | Vs. U.S. Avg. |
|---|---|---|
| Alabama | $107 | -31% |
| Alaska | $150 | -3% |
| Arizona | $168 | +8% |
| Arkansas | $118 | -24% |
| California | $264 | +70% |
| Colorado | $205 | +32% |
| Connecticut | $185 | +19% |
| Delaware | $148 | -5% |
| Florida | $157 | +1% |
| Georgia | $141 | -9% |
| Hawaii | $192 | +24% |
| Idaho | $136 | -12% |
| Illinois | $171 | +10% |
| Indiana | $126 | -19% |
| Iowa | $125 | -19% |
| Kansas | $126 | -19% |
| Kentucky | $122 | -21% |
| Louisiana | $128 | -17% |
| Maine | $124 | -20% |
| Maryland | $197 | +27% |
| Massachusetts | $237 | +53% |
| Michigan | $131 | -15% |
| Minnesota | $163 | +5% |
| Mississippi | $113 | -27% |
| Missouri | $128 | -17% |
| Montana | $124 | -20% |
| Nebraska | $131 | -15% |
| Nevada | $148 | -5% |
| New Hampshire | $166 | +7% |
| New Jersey | $210 | +35% |
| New Mexico | $131 | -15% |
| New York | $223 | +44% |
| North Carolina | $141 | -9% |
| North Dakota | $124 | -20% |
| Ohio | $131 | -15% |
| Oklahoma | $122 | -21% |
| Oregon | $191 | +23% |
| Pennsylvania | $145 | -6% |
| Rhode Island | $163 | +5% |
| South Carolina | $136 | -12% |
| South Dakota | $121 | -22% |
| Tennessee | $134 | -14% |
| Texas | $155 | 0% |
| Utah | $163 | +5% |
| Vermont | $128 | -17% |
| Virginia | $188 | +21% |
| Washington | $325 | +110% |
| West Virginia | $116 | -25% |
| Wisconsin | $136 | -12% |
| Wyoming | $136 | -12% |
- Washington ($325, +110%) leads all states, driven by high cleaning labor costs and affluent, dense metros such as Seattle and Bellevue with strong demand for recurring service, where cleaning companies compete hard for the same high-value households.
- California (+70%), Massachusetts (+53%), New York (+44%), New Jersey (+35%), and Colorado (+32%) round out the high-cost tier, combining elevated wages with dense, affluent suburbs and heavy paid competition.
- Alabama ($107) has the lowest recurring CAC, followed by Mississippi ($113), West Virginia ($116), Arkansas ($118), and Kentucky ($122), where lighter paid competition and strong neighborhood referral networks keep acquisition cost well below the national average.
- 18 of 50 states sit above the $155 average, because a group of high-wage metro states pulls the national figure up.
Average House Cleaning Recurring CAC by Lead Source: 2026
The chart below breaks down recurring client CAC by acquisition channel, combining cost per lead with channel-specific close rates and first-to-recurring conversion rates.
The table below shows the cost per lead and close rate behind each channel’s recurring CAC.
| Channel | Avg. Cost Per Lead | Avg. Close Rate | Notes |
|---|---|---|---|
| Client / Professional Referrals | $10-$30 | 45-60% | Highest quality; hardest to scale |
| Organic Search (SEO) | $35-$70 | 28-40% | Compounds over time; strongest long-term ROI |
| Google Local Services Ads | $25-$60 | 35-45% | Pre-screened intent; best volume-to-quality ratio |
| Nextdoor / Neighborhood Apps | $20-$48 | 25-38% | Effective in established local markets |
| Google Search Ads (PPC) | $60-$115 | 20-30% | High intent; competitive in metro markets |
| Meta Ads (Facebook / Instagram) | $40-$85 | 14-22% | Better as brand-building than direct response |
| Shared Lead Platforms (HomeAdvisor, Thumbtack) | $22-$50 | 8-14% | Low CPL offset by poor close rates on shared leads |
- Residential cleaning has one of the lowest average costs per lead of any home service category, at roughly $47 blended, so paid channels are more accessible for smaller operators than in higher-ticket trades.
- Shared lead platforms look cheap on cost per lead but close only 8-14% of leads, which pushes their recurring CAC as high as $480 once estimate time is factored in.
- Local Services Ads are the highest-leverage paid channel for most cleaning companies: pre-screened booking intent and 35-45% close rates produce CAC that rivals organic search, and they start working far sooner than a 6-12 month SEO build.
- Following up within 24-48 hours after a first cleaning, paired with an offer to lock in a bi-weekly schedule, is reported to lift first-to-recurring conversion from about 25% to over 50%, which would roughly halve recurring CAC at zero added ad spend.
Recurring Client CAC and Payback Period by Service Frequency: 2026
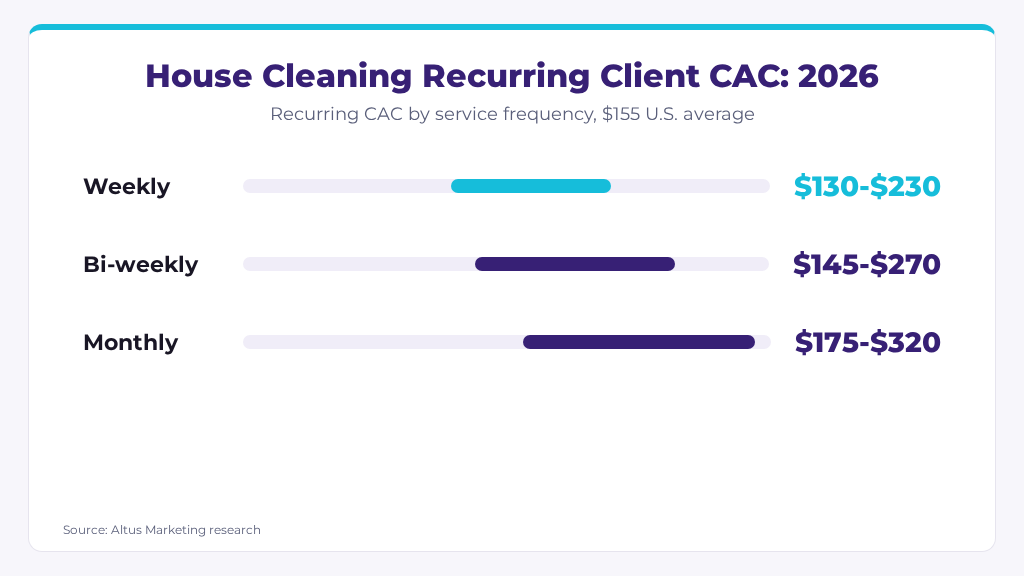
The table below breaks down how service frequency affects both CAC and the time it takes to earn back that acquisition cost, assuming average service pricing and a 50% contribution margin. Client lifetime value is 18 months of revenue.
| Service Frequency | Avg. Monthly Revenue Per Client | Avg. Recurring CAC | Avg. Payback Period | Avg. Client LTV (18 Months) |
|---|---|---|---|---|
| Weekly | $480-$640 | $130-$230 | 2-4 weeks | $8,640-$11,520 |
| Bi-weekly | $240-$360 | $145-$270 | 4-10 weeks | $4,320-$6,480 |
| Monthly | $110-$165 | $175-$320 | 9-25 weeks | $1,980-$2,970 |
- Weekly clients carry a slightly lower CAC because lead intent is higher; homeowners choosing weekly service have usually made the decision before they contact a provider.
- Monthly clients have both the highest CAC and the lowest LTV, which makes them the most expensive recurring segment to acquire on a return basis.
- A weekly client earns back their acquisition cost in about a month, while a monthly client can take up to six months.
- The gross-profit return on a bi-weekly client justifies higher short-term spend to win recurring clients over one-time bookings.
Average House Cleaning Recurring CAC by Business Size: 2026
The table below breaks down recurring CAC by annual revenue band, reflecting differences in channel mix, sales process, and brand recognition at each growth stage.
| Business Size (Annual Revenue) | Avg. Close Rate | Avg. Recurring CAC | Marketing as % of Revenue |
|---|---|---|---|
| Under $300K (solo / micro) | 32-45% | $75-$165 | 8-14% |
| $300K-$800K | 28-38% | $130-$240 | 7-11% |
| $800K-$2M | 30-40% | $145-$270 | 6-10% |
| $2M+ | 32-44% | $150-$300 | 5-9% |
- Solo and micro operators achieve the lowest CAC because their business is built almost entirely on referrals, Local Services Ads, and Nextdoor, channels with minimal overhead and strong conversion rates.
- The $300K-$800K band has the lowest close rate (28-38%) and sees the sharpest CAC jump of any stage, because businesses at that size scale paid channels before their review count and brand recognition catch up.
- Industry guidance estimates that holding 100+ reviews at a 4.8+ star average can lower paid channel CAC by 30-40%, which makes review generation one of the most cost-efficient investments a growing cleaning business can make.
- Companies past $2M pay the most per recurring client in absolute terms, but their lower marketing-as-a-percentage of revenue reflects the compounding value of their referral base and repeat booking rate.
Average House Cleaning Recurring CAC by Market Type: 2026
The chart below breaks down recurring CAC by market type, showing how competitive density, cost per lead, and first-to-recurring conversion rates shift across geographies.
| Market Type | Avg. Cost Per Lead | Vs. National Avg. |
|---|---|---|
| Top-25 Metro | $85-$175 | +26% to +145% |
| Mid-Size City | $55-$110 | -10% to +61% |
| Secondary / Suburban | $35-$75 | -32% to +26% |
| Rural / Small Town | $22-$55 | -58% to -10% |
- Metro markets have the most severe cost per lead inflation in residential cleaning: our analysis found Local Services Ads leads in high-cost metros run an estimated $60-$110 versus $25-$60 in standard markets, more than doubling the cost floor before close rates are factored in.
- Suburban markets are strong growth environments for cleaning businesses, combining lower cost per lead than core metros with dense referral networks and household incomes that support regular recurring schedules.
- Rural operators face low CAC but limited volume; SEO, Nextdoor, and referrals dominate because paid competition is minimal, and businesses that invest in organic visibility early hold durable market positions.
- Mid-size cities offer the best balance for operators looking to scale: enough digital lead volume to build a paid channel, while keeping cost per lead well under top-25 metro levels.
Conclusion
The recurring service model is what makes house cleaning acquisition economics work in a way few home service trades can match: a $155 CAC set against an 18-month LTV of $4,320-$6,480 for a bi-weekly client is a return profile that justifies more aggressive spend than competitors who think in one-time job terms. The businesses that capitalize on this invest in conversion infrastructure first, specifically response speed, follow-up systems, and review count, because those levers can cut true recurring CAC faster than any channel change.
- Our state benchmark points to location as a planning input: a cleaning company in a high-cost state should compare itself with its own state figure before deciding a channel is failing.
- The channel comparison makes clear that the cheapest lead is rarely the cheapest client, so cleaning owners should judge every channel by the signed recurring clients it produces.
- Payback math confirms that frequency matters as much as price: steering new clients toward weekly or bi-weekly plans at the first visit shortens the wait to profit far more than trimming ad spend.
- The market and conversion data highlight that fast, personal follow-up after the first clean is where most cleaning businesses can win back acquisition dollars while buying fewer leads.
If you’d like a PDF copy of this report or help lowering your cleaning company’s recurring client acquisition cost, contact Altus.
Sources
- Smart Marketing Playbook for Cleaning Business Owners
Publication: Cleaning Business Growth
URL: https://cleaningbusinessgrowth.com/?p=27053 - Cleaning Services Google Ads Statistics, 2026
Publication: Webtonic
URL: https://www.webtonic.io/blog/cleaning-services-google-ads-statistics - Cleaning Company Marketing Complete Guide 2026
Publication: Enrich Labs
URL: https://www.enrichlabs.ai/blog/cleaning-company-marketing-complete-guide-2026 - How to Calculate the Lifetime Value of a Residential Cleaning Customer
Publication: MaidCentral
URL: https://maidcentral.com/2021/06/24/how-to-calculate-the-lifetime-value-of-a-residential-cleaning-customer/ - How to Set Competitive Rates for Recurring House Cleaning Jobs
Publication: ZenMaid
URL: https://www.zenmaid.com/magazine/how-to-set-competitive-rates-for-recurring-house-cleaning-jobs/ - Cleaning Company Customer Retention
Publication: Dojo Business
URL: https://dojobusiness.com/blogs/news/cleaning-company-customer-retention