From April to September 2026, our research team used a weighted model to anchor marketing channel costs and close rates to 2025 and 2026 remodeling contractor benchmark datasets, covering thousands of ad accounts and estimate records and adjusting for local market conditions and project type.
In the sections below, we break down remodeling cost per signed project by state, by lead source, by project type, by business size, and by market type, giving remodeling contractors a realistic benchmark for evaluating their marketing spend.
Average Remodeling Cost Per Signed Project by State: 2026
| State | Avg. Cost Per Signed Project | Vs. U.S. Avg. |
|---|---|---|
| Alabama | $780 | -35% |
| Alaska | $2,100 | +75% |
| Arizona | $1,150 | -4% |
| Arkansas | $730 | -39% |
| California | $2,400 | +100% |
| Colorado | $1,550 | +29% |
| Connecticut | $1,450 | +21% |
| Delaware | $1,100 | -8% |
| Florida | $1,300 | +8% |
| Georgia | $1,050 | -13% |
| Hawaii | $2,600 | +117% |
| Idaho | $950 | -21% |
| Illinois | $1,500 | +25% |
| Indiana | $880 | -27% |
| Iowa | $820 | -32% |
| Kansas | $830 | -31% |
| Kentucky | $810 | -33% |
| Louisiana | $870 | -28% |
| Maine | $1,050 | -13% |
| Maryland | $1,550 | +29% |
| Massachusetts | $1,800 | +50% |
| Michigan | $980 | -18% |
| Minnesota | $1,100 | -8% |
| Mississippi | $720 | -40% |
| Missouri | $920 | -23% |
| Montana | $1,000 | -17% |
| Nebraska | $860 | -28% |
| Nevada | $1,350 | +13% |
| New Hampshire | $1,250 | +4% |
| New Jersey | $1,750 | +46% |
| New Mexico | $890 | -26% |
| New York | $2,200 | +83% |
| North Carolina | $1,100 | -8% |
| North Dakota | $800 | -33% |
| Ohio | $960 | -20% |
| Oklahoma | $830 | -31% |
| Oregon | $1,500 | +25% |
| Pennsylvania | $1,200 | 0% |
| Rhode Island | $1,350 | +13% |
| South Carolina | $980 | -18% |
| South Dakota | $790 | -34% |
| Tennessee | $1,050 | -13% |
| Texas | $1,250 | +4% |
| Utah | $1,150 | -4% |
| Vermont | $1,100 | -8% |
| Virginia | $1,400 | +17% |
| Washington | $1,700 | +42% |
| West Virginia | $740 | -38% |
| Wisconsin | $940 | -22% |
| Wyoming | $870 | -28% |
- Hawaii ($2,600) and California ($2,400) lead all states, both combining the highest labor costs with competitive paid search markets that drive CPL well above the national average
- Mississippi ($720), Arkansas ($730), and West Virginia ($740) have the lowest cost per signed project: thin paid competition and strong referral networks keep effective CAC well below the national average
- The $1,880 spread between the most and least expensive states is larger than the national average itself, underscoring how much geography shapes acquisition economics for remodelers
- States near major metros, such as Maryland, New Jersey, Virginia, and Connecticut, carry elevated costs even outside the core city, as suburban homeowners compete for limited contractor supply
Average Remodeling Cost Per Signed Project by Lead Source: 2026
| Channel | Avg. Close Rate | Avg. Cost Per Signed Project | Notes |
|---|---|---|---|
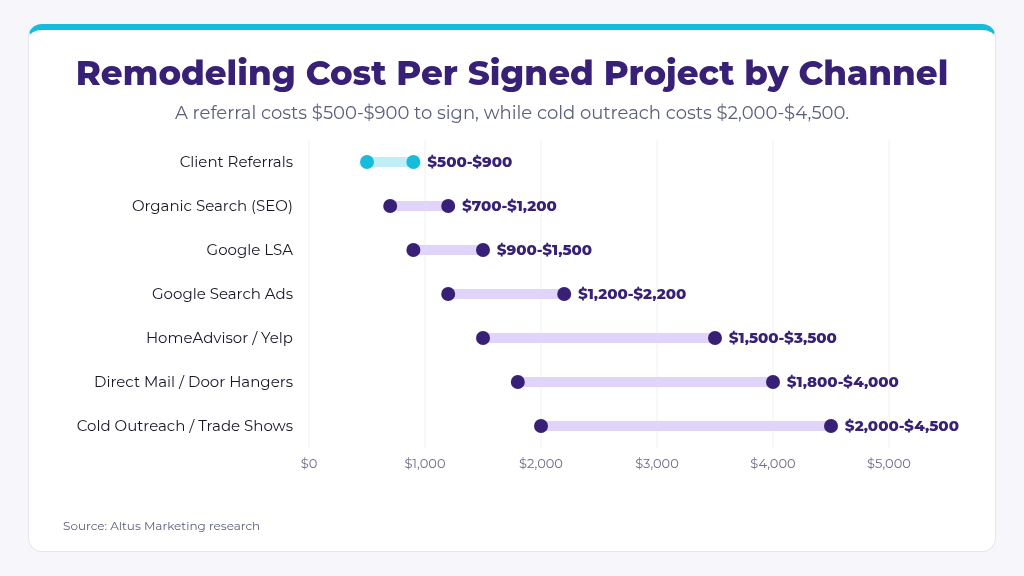
| Client Referrals | 55-70% | $500-$900 | Lowest-cost; hardest to scale |
| Organic Search (SEO) | 35-45% | $700-$1,200 | Strong long-term ROI; builds over 6-12 months |
| Google Local Services Ads | 30-40% | $900-$1,500 | Pre-screened leads; lower CPL than standard search |
| Google Search Ads (PPC) | 20-30% | $1,200-$2,200 | High intent; competitive in metro markets |
| HomeAdvisor / Yelp | 10-18% | $1,500-$3,500 | Shared leads drive close rates down |
| Direct Mail / Door Hangers | 3-8% | $1,800-$4,000 | Low response; works best for neighborhood saturation |
| Cold Outreach / Trade Shows | 8-15% | $2,000-$4,500 | High cost; best for commercial targets |
- Referrals close at roughly 3 to 7 times the rate of paid lead platforms, producing the lowest cost per signed project of any channel without a formal ad budget behind them
- Shared-lead platforms like HomeAdvisor look inexpensive per lead, but close rates below 18% multiply both ad spend and unbillable estimate hours
- Organic search delivers strong long-term economics: once rankings are established, incremental cost per lead drops while volume grows
- LSA pre-screens leads before delivery, which is why its close rates (30-40%) run significantly higher than standard PPC at the same or lower CPL
Average Remodeling Cost Per Signed Project by Project Type: 2026
This table breaks down cost per signed project by remodeling work type, showing how acquisition economics shift as project size and contract value increase.
| Project Type | Avg. Contract Value | Avg. Cost Per Signed Project | Cost as % of Contract |
|---|---|---|---|
| Handyman / Small Repairs | $500-$3,000 | $150-$400 | 10-20% |
| Bathroom Remodel | $8,000-$35,000 | $600-$1,400 | 4-8% |
| Kitchen Remodel | $20,000-$80,000 | $900-$2,200 | 2-5% |
| Basement Finish | $15,000-$50,000 | $700-$1,800 | 3-6% |
| Whole-Home Renovation | $75,000-$300,000+ | $1,500-$4,500 | 1-3% |
| Addition / ADU | $50,000-$200,000 | $1,200-$3,500 | 1-3% |
- Acquisition cost as a percentage of contract value drops sharply as project size grows: whole-home renovations and ADUs have some of the most favorable economics in residential construction
- Handyman and small repair work carries the worst acquisition economics by percentage; companies focused here need very high volume to offset thin margins after CAC
- Kitchen remodels sit at a strong middle ground: meaningful contract values, predictable digital demand, and the highest post-project referral rates of any category
- Additions and ADUs are increasingly driven by organic search intent, which keeps their effective CPL lower than the contract value might suggest
Average Remodeling Cost Per Signed Project by Business Size: 2026
This table shows how cost per signed project varies by annual revenue, reflecting differences in close rate, brand recognition, and marketing budget efficiency.
| Business Size (Annual Revenue) | Avg. Close Rate | Avg. Cost Per Signed Project | Marketing % of Revenue |
|---|---|---|---|
| Under $500K | 18-25% | $1,500-$3,500 | 8-12% |
| $500K-$2M | 25-33% | $1,000-$2,500 | 6-9% |
| $2M-$5M | 32-40% | $800-$1,800 | 5-8% |
| $5M+ | 38-48% | $600-$1,400 | 4-7% |
- Close rate improvement is the single highest-leverage variable for smaller remodelers: a 10-point close rate gain from a 20% base cuts CAC by roughly a third with no additional spend
- Larger firms carry lower marketing percentages because brand recognition and accumulated reviews convert leads passively, reducing paid channel dependency
- The $5M+ tier’s range reflects both stronger close rates and more selective lead sourcing: they turn away low-margin work that smaller firms accept
- Companies between $500K and $2M often overspend on paid channels before their close rate infrastructure can support them; investing in proposal and follow-up processes first pays faster dividends
Average Remodeling Cost Per Signed Project by Market Type: 2026
This chart breaks down cost per signed project by market type, showing how local competition and lead costs compound across geographies.
- Metro remodelers face compounding pressure: higher CPL and lower close rates simultaneously, as homeowners in competitive markets contact multiple contractors before committing
- The high project values in metro markets make this sustainable: a $3,000 cost to sign a $150,000 renovation is just 2% of contract value
- Suburban and rural markets benefit from lower CPL and stronger referral close rates, making organic search and referral systems the primary growth levers
- Mid-size cities offer the best balance: meaningful project volumes without the CPL inflation that characterizes top-25 metro markets
Conclusion
- Close rate improvement reduces cost per signed project faster than any channel change: moving from 20% to 30% cuts acquisition cost by 33% at identical spend
- Referrals close at roughly 3 to 7 times the rate of paid platforms and compound in value through post-project referral generation, making them the most important system any remodeler can invest in
- Acquisition cost as a percentage of contract value drops sharply as project size grows: whole-home renovations and additions carry some of the most favorable economics in residential construction
- State-level variation is extreme (Hawaii costs more than 3.5x Mississippi), meaning location shapes acquisition economics almost as much as channel and close rate combined
If you need help lowering your cost per signed project, or just want a PDF copy of this report, contact Altus.
Sources
- CAC Benchmark for Home Services Businesses 2026
Author: Amir Gomez
Publication: AmirGomez.com
Date: August 14, 2026
URL: https://www.amirgomez.com/blog/cac-benchmark-home-services-businesses-2026