From March through September 2026, our research team used a weighted model to anchor marketing channel costs for new clients to 2025 and 2026 landscaping industry benchmark datasets, covering thousands of lawn care and landscaping ad accounts and adjusting for local market conditions, seasonal demand patterns, and regional climate factors.
In the sections below, we break down landscaping and lawn care customer acquisition costs by state, by lead source, by business size, and by market type, and include a payback model showing how long it takes to earn back your marketing spend on a typical service agreement.
CAC by State
Landscaping and lawn care CAC varies by state based on advertising competition, seasonal service windows, homeownership rates, and the mix of recurring maintenance versus one-time project work in each market. States with longer growing seasons and high suburban homeownership tend to have stronger recurring-service demand, which improves conversion rates and lowers effective CAC.
| State | Avg. CAC |
|---|---|
| Alabama | $107 |
| Alaska | $201 |
| Arizona | $118 |
| Arkansas | $98 |
| California | $189 |
| Colorado | $148 |
| Connecticut | $158 |
| Delaware | $143 |
| Florida | $112 |
| Georgia | $109 |
| Hawaii | $312 |
| Idaho | $124 |
| Illinois | $157 |
| Indiana | $129 |
| Iowa | $117 |
| Kansas | $121 |
| Kentucky | $108 |
| Louisiana | $101 |
| Maine | $148 |
| Maryland | $161 |
| Massachusetts | $172 |
| Michigan | $138 |
| Minnesota | $143 |
| Mississippi | $84 |
| Missouri | $119 |
| Montana | $131 |
| Nebraska | $116 |
| Nevada | $154 |
| New Hampshire | $151 |
| New Jersey | $174 |
| New Mexico | $112 |
| New York | $191 |
| North Carolina | $114 |
| North Dakota | $122 |
| Ohio | $131 |
| Oklahoma | $104 |
| Oregon | $152 |
| Pennsylvania | $147 |
| Rhode Island | $159 |
| South Carolina | $111 |
| South Dakota | $118 |
| Tennessee | $110 |
| Texas | $122 |
| Utah | $137 |
| Vermont | $153 |
| Virginia | $144 |
| Washington | $158 |
| West Virginia | $102 |
| Wisconsin | $133 |
| Wyoming | $124 |
- Mississippi, Louisiana, Arkansas, and West Virginia sit at the low end of the range, where lower advertising costs and strong residential demand from long growing seasons keep CAC under $110
- Hawaii and New York anchor the high end, driven by expensive digital advertising markets and high competition from established regional operators
- Sun Belt states like Florida, Georgia, and the Carolinas maintain relatively low CAC despite high homeownership density, because long service seasons and recurring-plan demand keep conversion rates favorable
- Northern states with short growing seasons, including Maine, Vermont, and Minnesota, show elevated CAC because the effective marketing window is compressed and operators compete for the same clients in a short window
CAC by Lead Source
The channel mix matters significantly in landscaping and lawn care because the service category attracts both recurring maintenance clients and one-time project customers, and those two buyer types respond to different channels at different cost levels.
- Referrals remain the lowest-CAC channel at $47 and are especially powerful in lawn care because satisfied clients are visible to their neighbors every week during service
- Organic SEO and lawn sign campaigns are the two highest-ROI scalable channels, with SEO compounding over time and physical signage generating neighborhood-level awareness at low cost
- Google LSAs perform well for the category because landscaping queries carry strong local intent, and the verified badge improves trust for higher-ticket project estimates
- Facebook/Meta Ads and Google Ads carry the highest CAC, and third-party lead aggregators also tend to generate more price-shopper leads than intent-driven search channels
CAC by Business Size
Landscaping and lawn care businesses show a wide CAC range by size because the marketing channels that work for a solo operator with 20 accounts look very different from those used by a regional company managing hundreds of routes.
(1 crew)
(2-5 crews)
(6-20 crews)
(21-50 crews)
(50+ crews)
- Solo operators keep CAC low by relying on referrals, door-to-door canvassing, and neighborhood signage, channels that require sweat equity rather than ad budget
- The jump from small to mid-size often comes as companies begin investing in paid search without yet having the route density or brand equity to maximize conversion rates, while the steepest increases come at regional and large scale
- Regional operators absorb higher CAC because they are actively competing against national brands in paid channels and targeting a wider geographic footprint
- Large operations use CAC as a revenue lever rather than a cost to minimize, since their lifetime client value and upsell potential on landscape design and installation projects justify higher acquisition spend
CAC by Market Type
Urban, suburban, and rural landscaping markets have very different competitive dynamics. Dense urban markets have more operators competing for fewer residential properties, while suburban markets offer the highest concentration of homeowners with both recurring maintenance needs and renovation budgets.
| Market Type | Avg. CAC |
|---|---|
| Dense urban (1M+ metro) | $187 |
| Mid-size city (250K-1M) | $148 |
| Suburban market | $112 |
| Small city / town | $96 |
| Rural | $78 |
- Suburban markets are the highest-value segment for lawn care and landscaping CAC efficiency, combining strong homeowner density, recurring service demand, and manageable competition
- Rural markets show the lowest CAC but the trade-off is drive time between jobs, which reduces daily route profitability even when acquisition cost is low
- Dense urban markets are challenging for lawn care specifically because multi-family housing reduces the pool of homeowners with private lawn space, pushing operators to compete harder for a smaller addressable market
- Mid-size cities often represent the best growth target for regional operators, offering enough market depth at a CAC that is roughly 20% lower than major metro rates
Payback Period on Customer Acquisition Cost
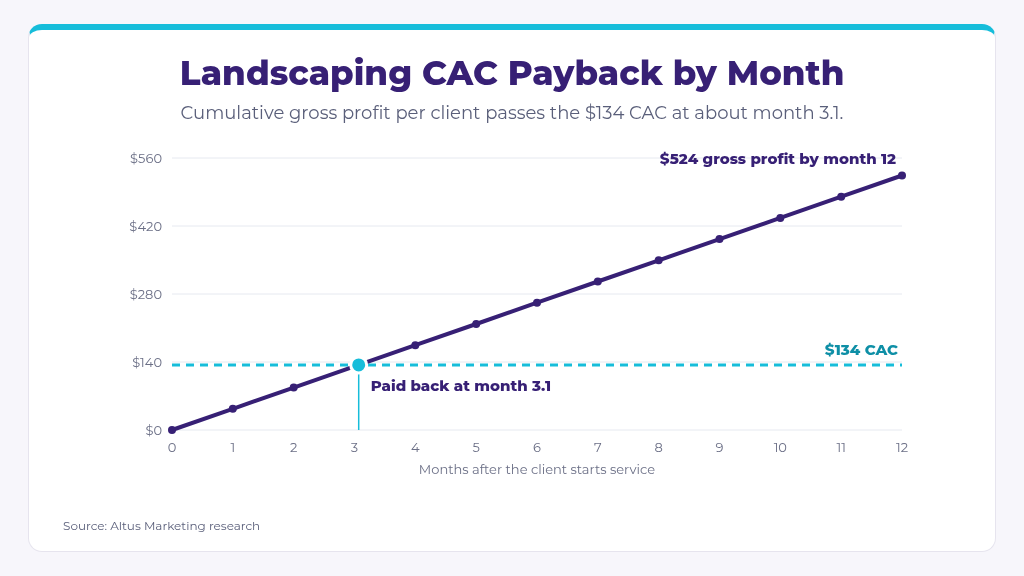
For landscaping and lawn care companies, the payback calculation depends heavily on whether a client is on a recurring maintenance plan or engaging for a one-time project. Recurring clients, typically weekly or biweekly mowing and seasonal programs, generate predictable gross profit across a full service season, which makes the $134 average CAC recoverable within a single season for most operators.
The figures below use a blended average weighted toward the recurring maintenance model, since that segment drives the majority of revenue for established lawn care businesses.
| Metric | Value |
|---|---|
| Average CAC | $134 |
| Average First-Year Revenue Per Client | $1,140 |
| Gross Profit Margin | 46% |
| Gross Profit Per Client (Year 1) | $524 |
| Months to Earn Back CAC | 3.1 |
| Revenue Per $1 of Marketing Spend | $8.51 |
| Client Retention Rate (Year 2) | 64% |
Conclusion
- The national weighted average CAC for landscaping and lawn care in 2026 is $134, with wide variation driven by state, market type, service mix, and business size
- Southern states and rural markets consistently show the lowest CAC, while Hawaii, New York, and dense urban metros push well above the national average
- Referrals and organic SEO are the two channels with the strongest long-term ROI; physical signage and Nextdoor round out the high-efficiency tier for neighborhood-level growth
- The small-to-mid-size transition is the most common CAC inflection point, as businesses shift from low-cost channels to paid advertising without fully optimizing conversion infrastructure
- The recurring maintenance model drives the favorable payback profile: at 46% gross margin and a 64% year-two retention rate, a $134 CAC pays back in roughly three months and improves further when clients are retained into a second season
If you need help lowering your customer acquisition cost, or just want a PDF copy of this report, contact Altus.
Methodology
From March through September 2026, Altus Marketing’s research team built a weighted composite model using data from landscaping and lawn care industry benchmarks, Google Ads performance data, franchise disclosure documents, and operator surveys across the U.S. CAC figures represent fully loaded marketing spend per acquired client, including ad spend, creative costs, and a proportional allocation of agency or software fees. State-level figures were adjusted for local market competition, regional climate and growing season length, and advertising cost indices. Lead source data reflects average performance across a mixed operator sample and should be treated as directional benchmarks rather than guaranteed outcomes for any individual business.
Sources
- Industry Report
Author: National Association of Landscape Professionals
Publication: National Association of Landscape Professionals
Date: Not stated
URL: https://www.landscapeprofessionals.org/nalp/Research/NALP/Tools___Resources/Industry_Research.aspx - Google Ads Benchmark Data for Home Services
Author: Google
Publication: Google Ads
Date: Not stated
URL: https://ads.google.com/home/resources/ - Google Ads Benchmarks 2026: Competitive Data & Insights for Every Industry
Author: Susie Marino
Publication: WordStream
Date: May 18, 2026
URL: https://www.wordstream.com/blog/2026-google-ads-benchmarks