From January through September 2026, our research team built a weighted acquisition model anchored to 2025 and 2026 dental practice marketing benchmarks, drawing on published dental marketing benchmarks, call tracking data, and practice management reports across channel types and practice sizes.
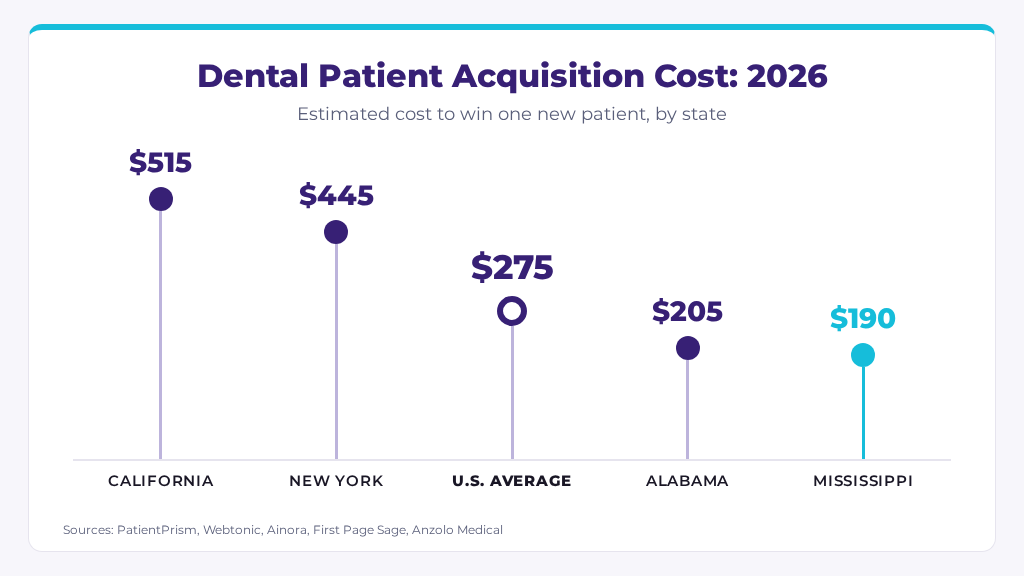
Our analysis found that the national average patient acquisition cost for dental practices is $275 in 2026. In the sections below, we break down dental CAC by state, acquisition channel, practice type, practice size, and market type.
Average Dental Patient Acquisition Cost by State: 2026
The table below breaks down the average cost for a dental practice to win one new patient in each of the 50 states, along with how each state compares to the $275 U.S. average.
| State | Avg. Patient CAC | Vs. U.S. Avg. |
|---|---|---|
| Alabama | $205 | -25% |
| Alaska | $275 | 0% |
| Arizona | $310 | +13% |
| Arkansas | $210 | -24% |
| California | $515 | +87% |
| Colorado | $365 | +33% |
| Connecticut | $315 | +15% |
| Delaware | $245 | -11% |
| Florida | $315 | +15% |
| Georgia | $265 | -4% |
| Hawaii | $370 | +35% |
| Idaho | $245 | -11% |
| Illinois | $290 | +5% |
| Indiana | $225 | -18% |
| Iowa | $220 | -20% |
| Kansas | $225 | -18% |
| Kentucky | $205 | -25% |
| Louisiana | $225 | -18% |
| Maine | $230 | -16% |
| Maryland | $330 | +20% |
| Massachusetts | $420 | +53% |
| Michigan | $235 | -15% |
| Minnesota | $265 | -4% |
| Mississippi | $190 | -31% |
| Missouri | $225 | -18% |
| Montana | $230 | -16% |
| Nebraska | $235 | -15% |
| Nevada | $280 | +2% |
| New Hampshire | $295 | +7% |
| New Jersey | $385 | +40% |
| New Mexico | $235 | -15% |
| New York | $445 | +62% |
| North Carolina | $265 | -4% |
| North Dakota | $235 | -15% |
| Ohio | $240 | -13% |
| Oklahoma | $215 | -22% |
| Oregon | $290 | +5% |
| Pennsylvania | $260 | -5% |
| Rhode Island | $290 | +5% |
| South Carolina | $245 | -11% |
| South Dakota | $225 | -18% |
| Tennessee | $240 | -13% |
| Texas | $340 | +24% |
| Utah | $290 | +5% |
| Vermont | $245 | -11% |
| Virginia | $290 | +5% |
| Washington | $405 | +47% |
| West Virginia | $205 | -25% |
| Wisconsin | $245 | -11% |
| Wyoming | $215 | -22% |
- California ($515, +87%) leads all states, driven by DSO and group-practice ad spend in dense metros where high-ticket cosmetic and implant demand pushes up CPCs; New York (+62%), Massachusetts (+53%), and Washington (+47%) follow.
- Texas (+24%) and Colorado (+33%) run well above the national average as fast-growing metros such as Dallas, Houston, Austin, and Denver draw heavy DSO expansion and paid search competition, alongside New Jersey at +40%.
- Mississippi ($190) has the lowest patient CAC, followed by West Virginia, Kentucky, and Alabama at $205 and Arkansas at $210, reflecting light paid competition, strong referral-driven close rates, and lower CPL across digital channels.
- 19 of 50 states sit above the $275 average, and Hawaii ($370) sits below the top tier, since its smaller island market with lighter DSO density keeps paid competition more moderate than in the largest mainland metros.
Average Dental Patient CAC by Acquisition Channel: 2026
The chart below breaks down patient CAC by channel for general-dentistry practices, drawing on published channel benchmarks for cost per lead and booking rate.
The table below shows the cost per lead and booking rate for each channel. Each CAC figure reflects total channel spend divided by new patients acquired, so it also absorbs the cost of every inquiry along the way to a booked visit; that is why some CAC ranges run higher than cost per lead divided by booking rate.
| Channel | Avg. Cost Per Lead | Avg. Booking Rate | Notes |
|---|---|---|---|
| Patient Referrals | $25-$75 | 72-85% | Highest quality; strongest LTV outcomes |
| Organic Search (SEO) | $20-$65 | 65-78% | Strongest long-term ROI; builds over 6-12 months |
| Review Sites (Google, Healthgrades) | $35-$95 | 63-76% | High intent; patients already in decision mode |
| Google Local Services Ads | $45-$110 | 55-68% | Pre-screened intent; strong for new patient volume |
| Google Search Ads (general dentistry) | $80-$160 | 45-60% | Competitive; effective with strong landing pages |
| Meta Ads (Facebook / Instagram) | $28-$80 | 35-50% | Lower booking rate; works well for cosmetic cases |
| Direct Mail | $60-$130 | 42-58% | Strong for new movers and reactivation campaigns |
| Google Search Ads (implants / cosmetic) | $180-$400 | 25-40% | High CPL; justified by high-value case LTV |
- Patient referrals produce the lowest CAC at $80-$180 and book at 72-85%, the highest rate of any channel; published benchmarks also rank referral programs as the highest-converting, lowest-cost patient source.
- SEO and review site visibility work together as a compounding pair: organic search books at 65-78% and review sites at 63-76%, the two strongest booking rates after referrals.
- The gap between general dentistry Google Ads ($180-$420) and implant and cosmetic search ($800-$2,000) reflects search intent as well as CPL; high-ticket procedure leads need more nurturing before they book.
- Call handling is the most undermanaged CAC variable in dental: Ainora estimates that losing 30% of leads to missed calls lifts a $200 nominal PAC to about $286, a 43% inflation across every paid channel.
Average Dental Patient CAC by Practice Type: 2026
The table below breaks down patient CAC by practice specialty, reflecting differences in procedure value, search intent, and channel mix at each care level. CAC as % of LTV runs from the lowest CAC against the highest LTV to the highest CAC against the lowest LTV.
| Practice Type | Avg. Patient CAC | Avg. Patient LTV | CAC as % of LTV |
|---|---|---|---|
| Pediatric Dentistry | $100-$250 | $2,500-$4,500 | 2-10% |
| General Dentistry | $150-$350 | $3,000-$5,000 | 3-12% |
| Cosmetic Dentistry | $350-$700 | $5,000-$15,000 | 2-14% |
| Orthodontics | $400-$800 | $5,000-$8,000 | 5-16% |
| Oral Surgery | $500-$900 | $6,000-$14,000 | 4-15% |
| Implants (standalone) | $800-$1,800 | $8,000-$40,000 | 2-22% |
- Pediatric and general dentistry have the lowest absolute CAC and rely on higher patient volume to sustain practice revenue, which makes retention and reactivation as important as acquisition.
- Implant practices carry the highest CAC in absolute terms and share the lowest CAC-to-LTV floor in the specialty mix at 2%, backed by the widest LTV range ($8,000-$40,000); a $1,200 acquisition cost against a $20,000 implant case is about a 17x return before any follow-on treatment is factored in.
- Cosmetic and orthodontic practices lean more heavily on social proof and visual content channels than general practices; Meta Ads and before-and-after organic content tend to outperform standard search for procedure intent.
- Oral surgery CAC is elevated partly by referral dependency; practices that invest in referring-doctor relationships alongside direct patient acquisition can lower blended CAC significantly.
Average Dental Patient CAC by Practice Size: 2026
The table below breaks down patient CAC by annual revenue, reflecting differences in brand recognition, channel mix, and front-desk conversion infrastructure at each growth stage.
| Practice Size (Annual Revenue) | Avg. Booking Rate | Avg. Patient CAC | Marketing as % of Revenue |
|---|---|---|---|
| Under $500K (solo, early-stage) | 52-62% | $180-$380 | 8-15% |
| $500K-$1.5M (established solo) | 58-68% | $200-$380 | 6-10% |
| $1.5M-$4M (small group) | 60-72% | $220-$420 | 5-9% |
| $4M+ (DSO / multi-location) | 63-72% | $290-$520 | 4-8% |
| New practice (pre-revenue) | 40-55% | $280-$600 | 20-30% |
- New practices carry the highest CAC ceiling ($600) and the lowest booking rates (40-55%) at the same time, because reviews, brand recognition, and front-desk experience are still being built; year-one spend is an investment in those foundations.
- Established solo practices in the $500K-$1.5M range often operate at a highly favorable CAC-to-revenue ratio, combining strong referral bases with selective paid channel spend.
- DSO and multi-location groups show the highest CAC floor ($290) despite stronger marketing infrastructure, with front-desk performance varying from site to site as a primary driver of blended acquisition cost.
- Because CAC moves inversely with booking rate, each 10-point booking-rate gain cuts effective patient CAC by roughly 12-17% across typical 50-80% booking rates on the same spend, so front-desk training often returns more per dollar than added media investment.
Average Dental Patient CAC by Market Type: 2026
The chart below breaks down patient CAC by market type, showing how competitive density and CPL shift across geographies for general-dentistry practices.
| Market Type | Avg. Cost Per Lead | Vs. National Avg. |
|---|---|---|
| Top-25 Metro | $110-$220 | +9% to +100% |
| Mid-Size City | $70-$145 | -20% to +38% |
| Secondary / Suburban | $45-$100 | -36% to +13% |
| Rural / Small Town | $25-$70 | -56% to -16% |
- Metro dental markets carry the steepest CPL: PatientPrism reports that practices in high-density metros typically pay 30-60% more per inquiry through paid channels, and Ainora cites dentist search ads at an $8.00 average cost per click, with about 15% of competitive dental keywords topping $10 per click (Webtonic).
- Suburban practices often achieve some of the best acquisition economics, pairing strong referral density from established residential neighborhoods with CPL that runs roughly 55-60% below top-25 metro levels in the table above.
- Rural practices enjoy low CAC alongside a smaller pool of new patients; practices in these markets that invest in SEO and Google Business Profile optimization can hold dominant visibility in a light competitive field.
- Mid-size city practices benefit from meaningful lead volume at CPL well under major metro levels, making them efficient markets for scaling patient acquisition through a balanced paid and organic channel mix.
Conclusion
Dental patient acquisition cost comes down to two variables that deserve as much attention as media spend: booking rate and referral infrastructure. A practice that books 70% of leads instead of 50% gets the same new patient output from about 29% less spend, using the same channels. Practices that add a referral system producing $80-$180 patients alongside their paid channels build an acquisition engine that grows more efficient as it scales.
- Our state benchmark points to geography as a major CAC driver in dental, so a practice in California, New York, or Massachusetts is best judged against its own state figure.
- The channel comparison makes clear that referrals and organic search deliver the most affordable new patients, which makes a structured referral program and a strong review profile worth building first.
- The practice type data confirms that implant and cosmetic practices operate in a separate acquisition economy, where a higher CAC is supported by case values many times larger than general dentistry.
- The booking-rate math highlights the front desk as the fastest lever for most practices: answering every call and converting more inquiries lowers CAC on the exact same ad budget.
If you’d like a PDF copy of this report or help lowering your practice’s patient acquisition cost, contact Altus.
Sources
- Patient Acquisition Cost: Benchmarks, Variables, and the Conversion Optimization Opportunity
Publication: PatientPrism
URL: https://www.patientprism.com/blog/patient-acquisition-cost-benchmarks-conversion-optimization-2026/ - Inside Dental Digital Marketing Strategy: Key Statistics & Insights for 2026
Publication: Webtonic
URL: https://www.webtonic.io/blog/dental-digital-marketing-statistics - Dental Patient Acquisition Cost: What It Really Takes (2026 Data)
Publication: Ainora
URL: https://ainora.lt/blog/dental-patient-acquisition-cost-statistics - Average Patient Acquisition Cost: 2026 Report
Publication: First Page Sage
URL: https://firstpagesage.com/seo-blog/average-patient-acquisition-cost/ - Dental Marketing Attribution Statistics: 2026 Channel ROI & Tracking Data
Publication: Webtonic
URL: https://www.webtonic.io/blog/dental-marketing-attribution-statistics - Patient Acquisition ROI: The Complete 2025 Guide to Measuring and Maximizing Healthcare Marketing Returns
Publication: Anzolo Medical
URL: https://business.anzolomed.com/patient-acquisition-roi-the-complete-2025-guide-to-measuring-and-maximizing-healthcare-marketing-returns/