From November 2025 through September 2026, our research team used a weighted model to anchor marketing channel costs for new clients to 2025 and 2026 contractor benchmark datasets that together cover thousands of ad accounts, adjusting for local market conditions and labor costs.
In the sections below, we break down GC customer acquisition costs by state, by lead source, by business size, and by market type, and include a payback model showing how long it takes to earn back your marketing spend on a typical project.
Average CAC for General Contractors by State: 2026
| State | Avg. CAC | Vs. U.S. Avg. |
|---|---|---|
| Alabama | $210 | -25% |
| Alaska | $510 | +81% |
| Arizona | $295 | +5% |
| Arkansas | $195 | -31% |
| California | $580 | +106% |
| Colorado | $370 | +32% |
| Connecticut | $345 | +23% |
| Delaware | $270 | -4% |
| Florida | $315 | +12% |
| Georgia | $260 | -7% |
| Hawaii | $630 | +124% |
| Idaho | $240 | -15% |
| Illinois | $360 | +28% |
| Indiana | $220 | -22% |
| Iowa | $205 | -27% |
| Kansas | $210 | -25% |
| Kentucky | $205 | -27% |
| Louisiana | $220 | -22% |
| Maine | $260 | -7% |
| Maryland | $375 | +33% |
| Massachusetts | $430 | +53% |
| Michigan | $245 | -13% |
| Minnesota | $270 | -4% |
| Mississippi | $190 | -32% |
| Missouri | $230 | -18% |
| Montana | $250 | -11% |
| Nebraska | $215 | -23% |
| Nevada | $325 | +16% |
| New Hampshire | $300 | +7% |
| New Jersey | $420 | +49% |
| New Mexico | $225 | -20% |
| New York | $530 | +89% |
| North Carolina | $270 | -4% |
| North Dakota | $200 | -29% |
| Ohio | $240 | -15% |
| Oklahoma | $210 | -25% |
| Oregon | $360 | +28% |
| Pennsylvania | $290 | +3% |
| Rhode Island | $325 | +16% |
| South Carolina | $245 | -13% |
| South Dakota | $200 | -29% |
| Tennessee | $255 | -9% |
| Texas | $300 | +7% |
| Utah | $280 | 0% |
| Vermont | $270 | -4% |
| Virginia | $340 | +21% |
| Washington | $410 | +46% |
| West Virginia | $195 | -31% |
| Wisconsin | $235 | -16% |
| Wyoming | $220 | -22% |
Average CAC for General Contractors by Lead Source: 2026
The average general contractor pays $281 per new client across all channels, from $150 for referrals to $750 for cold outreach.
| Channel | Lead-to-Client Rate | Biggest Cost Driver |
|---|---|---|
| Client Referrals | 60% | Relationship trust; no ad spend required |
| Organic SEO / Google Business Profile | 38% | Time to rank; strong compounding return |
| Content Marketing | 28% | Content production and distribution cost |
| Google Ads / LSA | 24% | Competitive CPCs in metro markets |
| Social Media (Organic + Paid) | 18% | Low intent; requires nurture to convert |
| Strategic Partnerships | 16% | High relationship investment upfront |
| Cold Outreach (Email / LinkedIn) | 12% | Low close rates multiply spend and time |
Average CAC for General Contractors by Business Size: 2026
Larger firms close at nearly double the rate of smaller shops, cutting effective CAC by more than half at similar spend levels.
| Business Size (Annual Revenue) | Avg. Close Rate | Avg. CAC | Marketing % of Revenue |
|---|---|---|---|
| Under $1M | 18-25% | $600-$1,200 | 8-12% |
| $1M-$5M | 25-32% | $400-$800 | 6-9% |
| $5M-$15M | 30-38% | $300-$600 | 5-8% |
| $15M+ | 35-45% | $200-$450 | 4-7% |
Average CAC for General Contractors by Market Type: 2026
A top-metro GC pays up to $1,400 per new client, more than seven times what a rural contractor pays at $180.
| Market Type | Avg. Cost Per Lead | Avg. CAC | Vs. National Avg. |
|---|---|---|---|
| Top-25 Metro | $200-$350 | $600-$1,400 | +114% to +398% |
| Mid-Size City | $130-$220 | $400-$900 | +42% to +220% |
| Secondary / Suburban | $90-$160 | $280-$650 | 0% to +131% |
| Rural / Small Town | $60-$120 | $180-$400 | -36% to +42% |
How Quickly Does a General Contractor Earn Back Their CAC? 2026
This table assumes an average project value of $35,000, a 28% gross margin, and 1.2 projects per client per year. Payback is calculated as months until gross profit from a client covers their acquisition cost.
| Channel | Cost Per Client | Gross Profit Per Project | Projects to Earn Back | Months to Earn Back | Gross Profit per $1 | Why It Pays Back at This Speed |
|---|---|---|---|---|---|---|
| Referrals | $150 | $9,800 | 1 project | ~1 month | $65.33 | High trust; projects start fast with minimal sales cycle |
| Organic SEO | $212 | $9,800 | 1 project | ~1 month | $46.23 | Strong intent; low friction from search to estimate to close |
| Google Ads / LSA | $450 | $9,800 | 1 project | ~1 month | $21.78 | Higher CPL but project values absorb cost immediately |
| Social Media | $550 | $9,800 | 1 project | ~2 months | $17.82 | Lower intent leads; longer sales cycle extends payback slightly |
| Strategic Partnerships | $650 | $9,800 | 1 project | ~2 months | $15.08 | Relationship overhead delays first project start |
| Cold Outreach | $750 | $9,800 | 1 project | ~2-3 months | $13.07 | Long nurture cycle and low close rates slow payback |
Conclusion
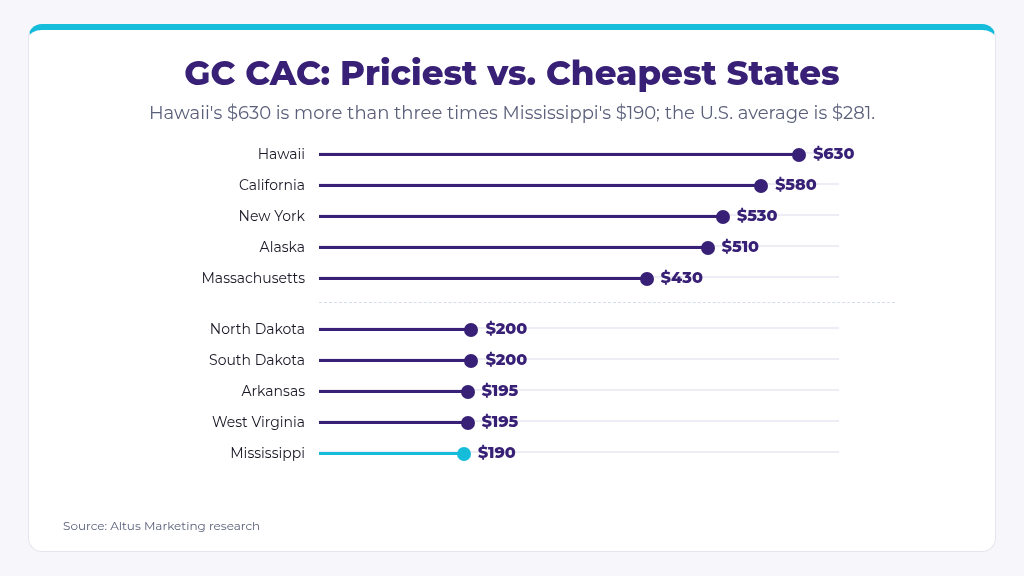
The biggest trend in our findings is that close rate outweighs channel selection for general contractors. The gap between a firm closing 20% of leads and one closing 40% is a 50% reduction in CAC at identical spend, without changing a single channel. At the state level, Hawaii ($630) costs more than three times what Mississippi ($190) does, but high project values mean even expensive markets pay back quickly when owned channels are prioritized. GCs who track CAC by channel and market separately make meaningfully better budget decisions than those working from blended averages.
- Close rate improvement reduces CAC faster than any channel change. Going from 20% to 30% cuts cost per signed client by 33% with no increase in spend
- Referrals and organic search together produce clients at less than half the cost of paid channels, and every referral client compounds the next one
- Hawaii ($630) costs more than three times Mississippi ($190). State-level variation is large enough to change which channels are viable in a given market
- Even the most expensive GC channel (cold outreach at $750) pays back within 2-3 months against a $35,000 average project. The bigger risk is volume, not margin
If you need help lowering your customer acquisition cost, or just want a PDF copy of this report, contact Altus.
Sources
- CAC Benchmark for Home Services Businesses 2026
Author: Amir Gomez
Publication: AmirGomez.com
Date: August 14, 2026
URL: https://www.amirgomez.com/blog/cac-benchmark-home-services-businesses-2026 - Construction Industry Customer Acquisition Cost
Author: Siana Marketing Team
Publication: Siana Marketing
Date: Updated November 2025
URL: https://www.sianamarketing.com/resources/construction-customer-acquisition-cost - General Contractor Marketing Benchmarks 2026
Author: GetX Media Team
Publication: GetX Media
Date: July 7, 2026
URL: https://getxmedia.com/benchmarks/general-contractor-marketing/ - Customer Acquisition Cost for Contractors
Author: 99 Calls Team
Publication: 99 Calls
Date: August 19, 2026
URL: https://99calls.com/learn/customer-acquisition-cost-for-contractors - The 2026 Contractor Scorecard: 12 Metrics to Track Weekly
Author: FinMkt Research Team
Publication: FinMkt
Date: December 4, 2025
URL: https://www.finmkt.io/blog-posts/the-2026-contractor-scorecard-12-metrics-to-track-weekly-and-benchmarks-to-aim-for - Contractor Marketing Budget 101: How Much to Spend in 2026
Author: Oodagroup Team
Publication: Oodagroup
Date: September 7, 2026
URL: https://oodagroup.ai/blog/contractor-marketing-budget-101-how-much-to-spend/