Last Updated: June 29th, 2026
Our research team tracked SEO performance data from November 2025 through May 2026 across 1,600 small business client accounts with 12 or more months of consistent SEO investment. Metrics measured include monthly organic traffic, conversion rate, monthly leads, and top 10 keyword rankings, tracked through Google Analytics GA4 and Google Search Console. The table below breaks down average monthly leads from SEO across 36 small business industries.
SEO Performance Benchmarks by Small Business Industry
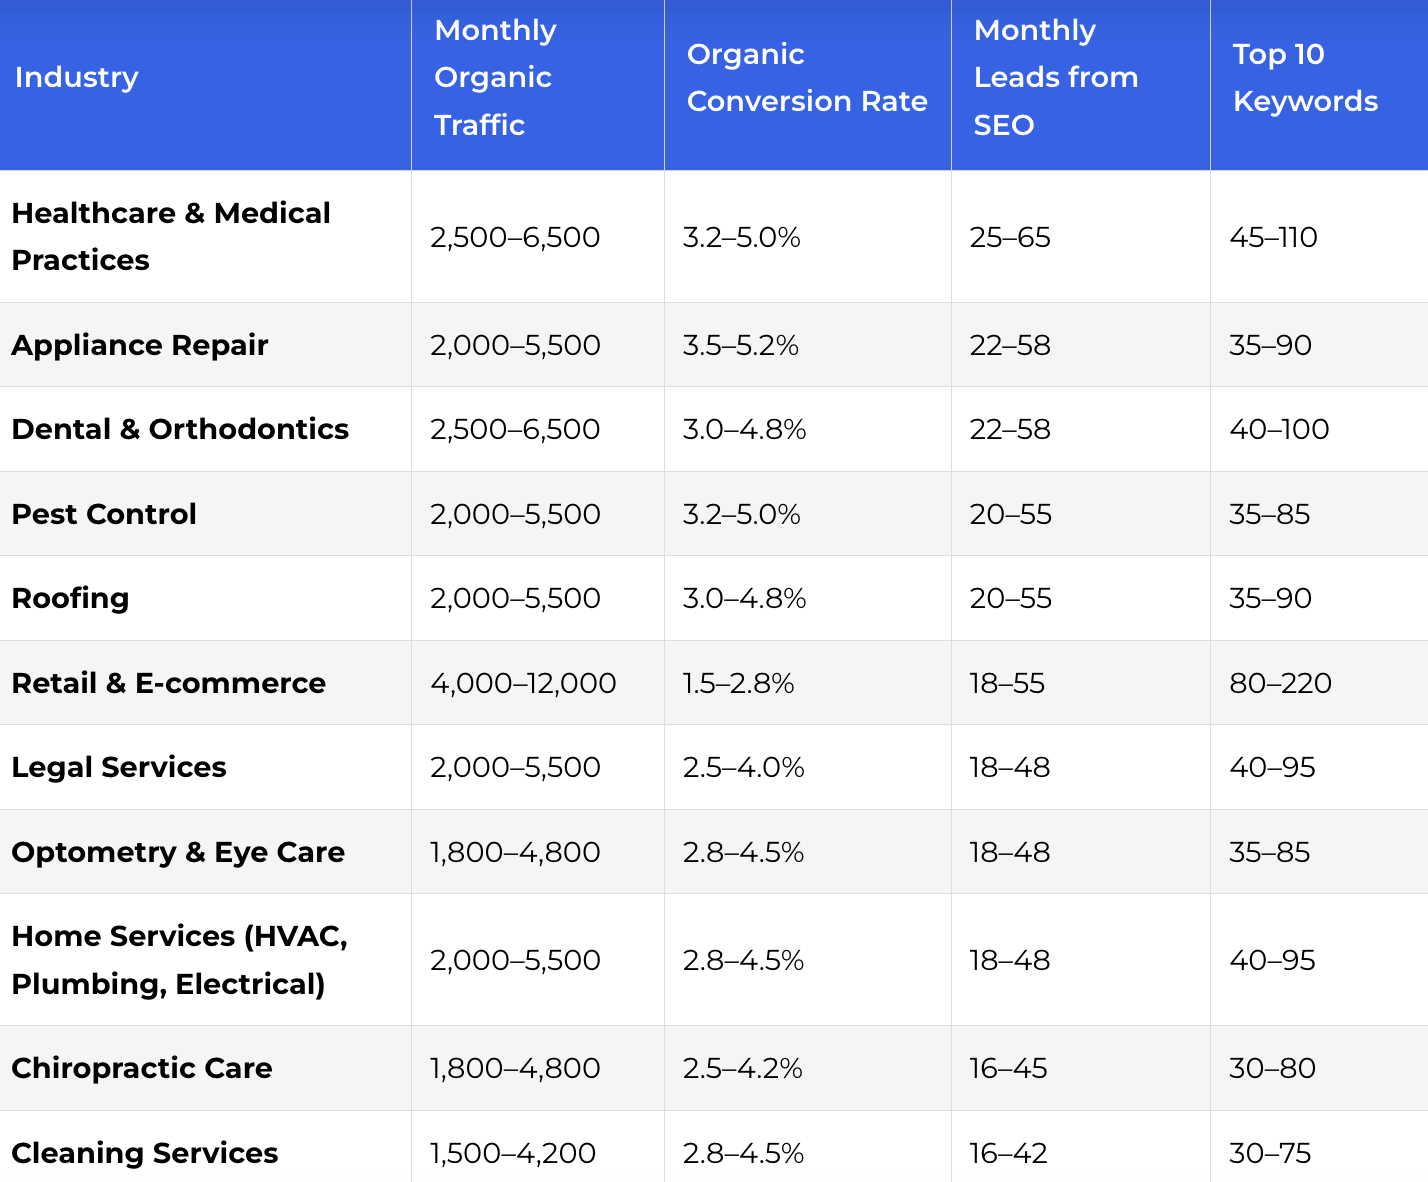
In the table below, we have published the average monthly leads from SEO across 36 small business industries. Small businesses generate an average of 25 leads per month from SEO, though businesses serving customers with urgent or high-trust needs, such as healthcare practices and appliance repair services, generate 65 or more leads per month, while photography and wedding services businesses typically generate fewer than 20.
| Industry | Monthly Organic Traffic | Organic Conversion Rate | Monthly Leads from SEO | Top 10 Keywords |
|---|---|---|---|---|
| Healthcare & Medical Practices | 2,500–6,500 | 3.2–5.0% | 25–65 | 45–110 |
| Appliance Repair | 2,000–5,500 | 3.5–5.2% | 22–58 | 35–90 |
| Dental & Orthodontics | 2,500–6,500 | 3.0–4.8% | 22–58 | 40–100 |
| Pest Control | 2,000–5,500 | 3.2–5.0% | 20–55 | 35–85 |
| Roofing | 2,000–5,500 | 3.0–4.8% | 20–55 | 35–90 |
| Retail & E-commerce | 4,000–12,000 | 1.5–2.8% | 18–55 | 80–220 |
| Legal Services | 2,000–5,500 | 2.5–4.0% | 18–48 | 40–95 |
| Optometry & Eye Care | 1,800–4,800 | 2.8–4.5% | 18–48 | 35–85 |
| Home Services (HVAC, Plumbing, Electrical) | 2,000–5,500 | 2.8–4.5% | 18–48 | 40–95 |
| Chiropractic Care | 1,800–4,800 | 2.5–4.2% | 16–45 | 30–80 |
| Cleaning Services | 1,500–4,200 | 2.8–4.5% | 16–42 | 30–75 |
| Physical Therapy & Rehabilitation | 1,800–4,800 | 2.5–4.2% | 16–42 | 30–80 |
| Veterinary Services | 1,800–4,800 | 2.2–4.0% | 14–40 | 30–80 |
| IT Services & Computer Repair | 1,800–5,000 | 2.2–3.8% | 14–40 | 35–90 |
| Landscaping & Lawn Care | 1,500–4,200 | 2.2–4.0% | 14–38 | 28–72 |
| Accounting & Tax Services | 1,800–4,800 | 2.2–3.8% | 12–38 | 35–80 |
| Car Detailing | 1,200–3,500 | 2.5–4.2% | 12–35 | 25–65 |
| Financial & Wealth Management | 2,200–5,800 | 1.8–3.2% | 12–35 | 40–100 |
| Insurance (Independent Agents) | 1,800–5,000 | 2.0–3.5% | 12–35 | 35–85 |
| Senior Care & Home Health Aide | 1,500–4,200 | 2.0–3.5% | 12–35 | 28–72 |
| Childcare & Early Education | 1,500–4,200 | 2.2–3.8% | 12–35 | 28–70 |
| Pool Service & Maintenance | 1,200–3,500 | 2.2–3.8% | 12–32 | 25–65 |
| Tutoring & Test Prep | 1,200–3,500 | 2.0–3.5% | 10–32 | 25–65 |
| Mental Health & Counseling | 1,500–4,200 | 2.0–3.5% | 10–32 | 28–72 |
| Automotive Services | 1,500–4,200 | 2.0–3.5% | 10–32 | 28–72 |
| Fitness & Wellness | 1,500–4,200 | 1.8–3.2% | 10–30 | 28–72 |
| Real Estate | 2,500–6,500 | 1.8–3.2% | 10–30 | 45–110 |
| Restaurants & Food Service | 3,000–8,000 | 1.5–2.8% | 10–28 | 45–130 |
| Remodeling & General Contracting | 1,500–4,200 | 1.8–3.2% | 10–28 | 28–70 |
| Mortgage & Lending (Brokers) | 1,800–5,000 | 1.6–3.0% | 8–25 | 32–80 |
| Pet Services (Grooming, Boarding) | 1,200–3,500 | 1.8–3.2% | 8–25 | 22–58 |
| Beauty & Personal Care | 1,200–3,500 | 1.5–2.8% | 8–22 | 22–58 |
| Moving & Storage | 1,200–3,500 | 1.5–2.8% | 6–20 | 20–55 |
| Event Planning & Catering | 1,200–3,500 | 1.4–2.5% | 6–18 | 20–52 |
| Wedding Services | 1,500–4,200 | 1.4–2.5% | 6–18 | 25–62 |
| Photography & Creative Services | 1,200–3,500 | 1.2–2.2% | 5–16 | 20–50 |
The data shows that MQL generation from organic search is driven by a combination of search volume, purchase urgency, and conversion action simplicity. Industries at the top of the table serve visitors who have already identified a specific need and are ready to act within hours or the same day. Industries at the bottom serve visitors who are still in early-stage research, comparing options over days or weeks before making contact. Both categories benefit from consistent SEO investment, but the timeline to qualified lead generation and the volume of MQLs per month differ substantially based on these behavioral patterns.
Industries with the Highest Monthly MQL Generation from SEO
The table below identifies the six small business industries generating the highest volume of monthly MQLs from organic search, alongside the primary driver of strong lead performance in each category.
| Industry | Monthly MQLs | Organic Conversion Rate | Primary Driver of High MQL Volume |
|---|---|---|---|
| Healthcare & Medical Practices | 25-65 | 3.2-5.0% | Routine and urgent appointment needs drive consistent high-intent search volume year-round |
| Appliance Repair | 22-58 | 3.5-5.2% | Emergency intent produces same-session conversion from visitors with immediate, time-sensitive problems |
| Dental & Orthodontics | 22-58 | 3.0-4.8% | Broad appeal across age groups combined with both routine and urgent appointment needs sustains high MQL volume |
| Pest Control | 20-55 | 3.2-5.0% | Active infestation searches carry extremely high urgency; visitors convert on the same session in most cases |
| Roofing | 20-55 | 3.0-4.8% | Weather-event and damage-related searches generate bursts of emergency-intent traffic that converts at high rates |
| Home Services (HVAC, Plumbing, Electrical) | 18-48 | 2.8-4.5% | Service failure searches dominate this category; visitors call or book within minutes of finding a qualified provider |
The data shows that the highest-MQL industries share a defining characteristic: organic visitors arrive because something has gone wrong or a scheduled need has come due. Healthcare appointments, pest infestations, broken appliances, roof damage, and failed HVAC systems all create a search session with a predetermined outcome. The visitor requires a specific service from a local provider and is prepared to convert on the first visit. Small businesses in these categories that establish strong local SEO foundations within the first three months of a campaign are positioned to capture this intent-ready traffic consistently, reaching benchmark MQL volumes within the three-to-six-month window our data shows.
Industries with the Lowest Monthly MQL Generation from SEO
The table below identifies the six small business industries generating the lowest volume of monthly MQLs from organic search, alongside the primary factor limiting lead volume in each category.
| Industry | Monthly MQLs | Organic Conversion Rate | Primary Driver of Low MQL Volume |
|---|---|---|---|
| Photography & Creative Services | 5-16 | 1.2-2.2% | Portfolio review and personal rapport requirements mean visitors rarely convert on a first organic session |
| Wedding Services | 6-18 | 1.4-2.5% | Planning timelines of 6-18 months mean most organic visitors are in early research and convert across multiple sessions |
| Event Planning & Catering | 6-18 | 1.4-2.5% | Relationship-driven vendor selection and long planning horizons push conversion well beyond the first visit |
| Moving & Storage | 6-20 | 1.5-2.8% | Multi-quote comparison behavior is standard; visitors contact several providers before committing to one |
| Beauty & Personal Care | 8-22 | 1.5-2.8% | Repeat customer loyalty and walk-in culture limit first-session organic conversions from new visitors |
| Pet Services (Grooming, Boarding) | 8-25 | 1.8-3.2% | Lower overall search volume in most local markets caps total MQL potential regardless of conversion rate |
The data reveal that low-MQL industries are defined by decision complexity rather than low market demand. Visitors searching for photographers, wedding planners, and event caterers are genuinely interested but require more time, more touchpoints, and more trust-building before converting. For small businesses in these categories, SEO builds brand visibility and authority over time, but monthly MQL volumes remain structurally lower. Retargeting campaigns, lead magnets, and consultation-based conversion actions help recover visitors who researched but did not convert on their first organic session.
SEO Performance Benchmarks by Business Maturity Stage
SEO performance benchmarks shift substantially as a small business grows and compounds its organic authority. The table below presents expected SEO performance ranges by business maturity stage, based on client data from November 2025 to May 2026.
| Business Stage | Business Age | Monthly Organic Traffic | Conversion Rate | Monthly MQLs | Top 10 Keywords |
|---|---|---|---|---|---|
| New Business | 0-12 months | 100-500 | 1.2-2.2% | 1-6 | 3-18 |
| Growing Business | 1-3 years | 500-1,800 | 2.0-3.2% | 6-20 | 18-55 |
| Established Business | 3-5 years | 1,500-5,500 | 2.5-4.0% | 18-48 | 40-110 |
| Scaling Business | 5+ years | 4,000-12,000+ | 3.0-4.5% | 35-80+ | 80-200+ |
The data indicates that the jump from the growing stage to the established stage represents the most significant performance inflection point in small business SEO. Monthly MQL volume typically triples between years one and three as domain authority compounds, top 10 keyword rankings accumulate, and Google’s local algorithm begins consistently surfacing the business for its primary service terms. New businesses should expect a three-to-six-month ramp period before organic traffic and MQL generation reach meaningful levels. Businesses that reach the established and scaling stages with consistent investment see organic search become their primary and lowest-cost lead generation channel, with MQL volume and conversion rates continuing to improve as authority and content depth grow.
How to Use These Benchmarks
Compare your current performance to the benchmarks for your industry. If you’re hitting or exceeding the ranges shown, your SEO strategy is working. If you’re significantly below benchmarks, identify where the gap exists.
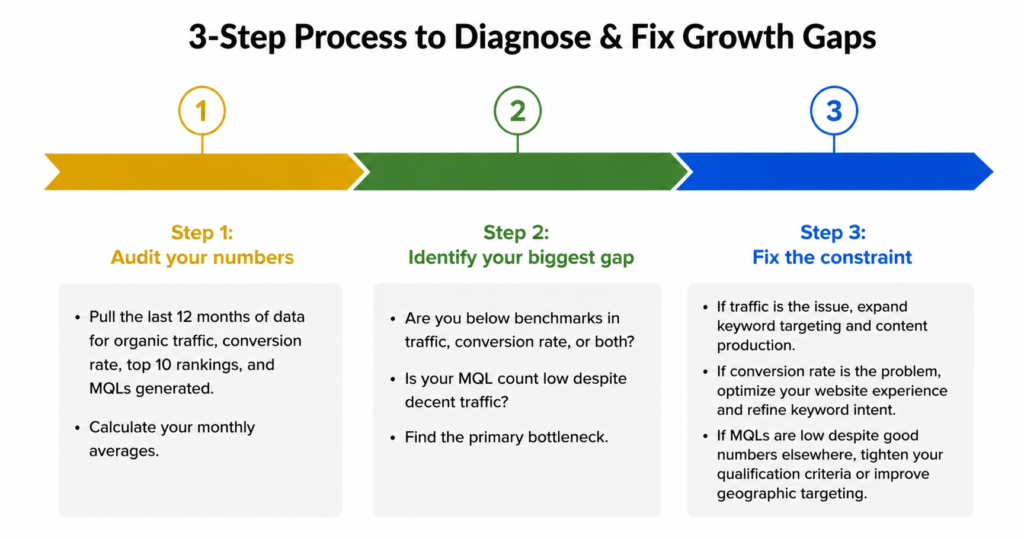
Start by auditing your numbers. Pull the last 12 months of data for organic traffic, conversion rate, top 10 rankings, and MQLs generated, then calculate your monthly averages. Once you have your baseline, identify your biggest gap. Are you below benchmarks in traffic, conversion rate, or both? Is your MQL count low despite decent traffic? Find the primary bottleneck holding back your performance. Finally, fix the constraint. If traffic is the issue, expand keyword targeting and content production. If conversion rate is the problem, optimize your website experience and refine keyword intent. If MQLs are low despite good numbers elsewhere, tighten your qualification criteria or improve geographic targeting.
If you’d like to request a PDF copy of this report or learn more about our agency, you can reach out here.
Related Reading
SEO & GEO Campaign Strategy for Small Businesses: 2026 Playbook
Local SEO for Small Businesses
SEO Strategy for Small Businesses
How Long Does SEO Take to Work
SEO Conversion Rate by Small Business Industry: 2026
Sources
- Altus Marketing Research Study. Altus Marketing, New York, NY. May 2026.
- First Page Sage. “B2B Conversion Rates by Industry: 2026.” Evan Bailyn, First Page Sage, San Francisco, CA. September 2025. https://firstpagesage.com/reports/b2b-conversion-rates-by-industry-fc/
- BrightLocal. “Local Consumer Review Survey 2026.” BrightLocal. 2026. https://www.brightlocal.com/research/
- Semrush. “Organic Search Benchmarks for Small Businesses 2026.” Semrush, Boston, MA. 2026.
- Ruler Analytics. “Average Conversion Rate by Industry and Marketing Source 2025.” Katie Rigby, Ruler Analytics. August 2025. https://www.ruleranalytics.com/blog/insight/conversion-rate-by-industry/