What share of organic search visitors actually become leads, and is organic traffic more or less likely to convert than paid search traffic? Our analysis of published conversion data across 13 industries found that organic search converts an average of 4.9% of visits into qualified leads or sales, ranging from 1.8% in health & social care and travel to 8.1% in professional services.
How we derived these figures: We started from Ruler Analytics’ 2026 conversion rate benchmarks, which report organic search, paid search and all-channel conversion rates by industry from more than 110 million tracked sessions. From those inputs we calculated the organic versus paid gap for each industry, expected leads per 1,000 organic visits, and the change from Ruler’s 2025 figures, then cross-checked against First Page Sage’s B2B conversion rate report. Every calculation is shown in the Methodology section.
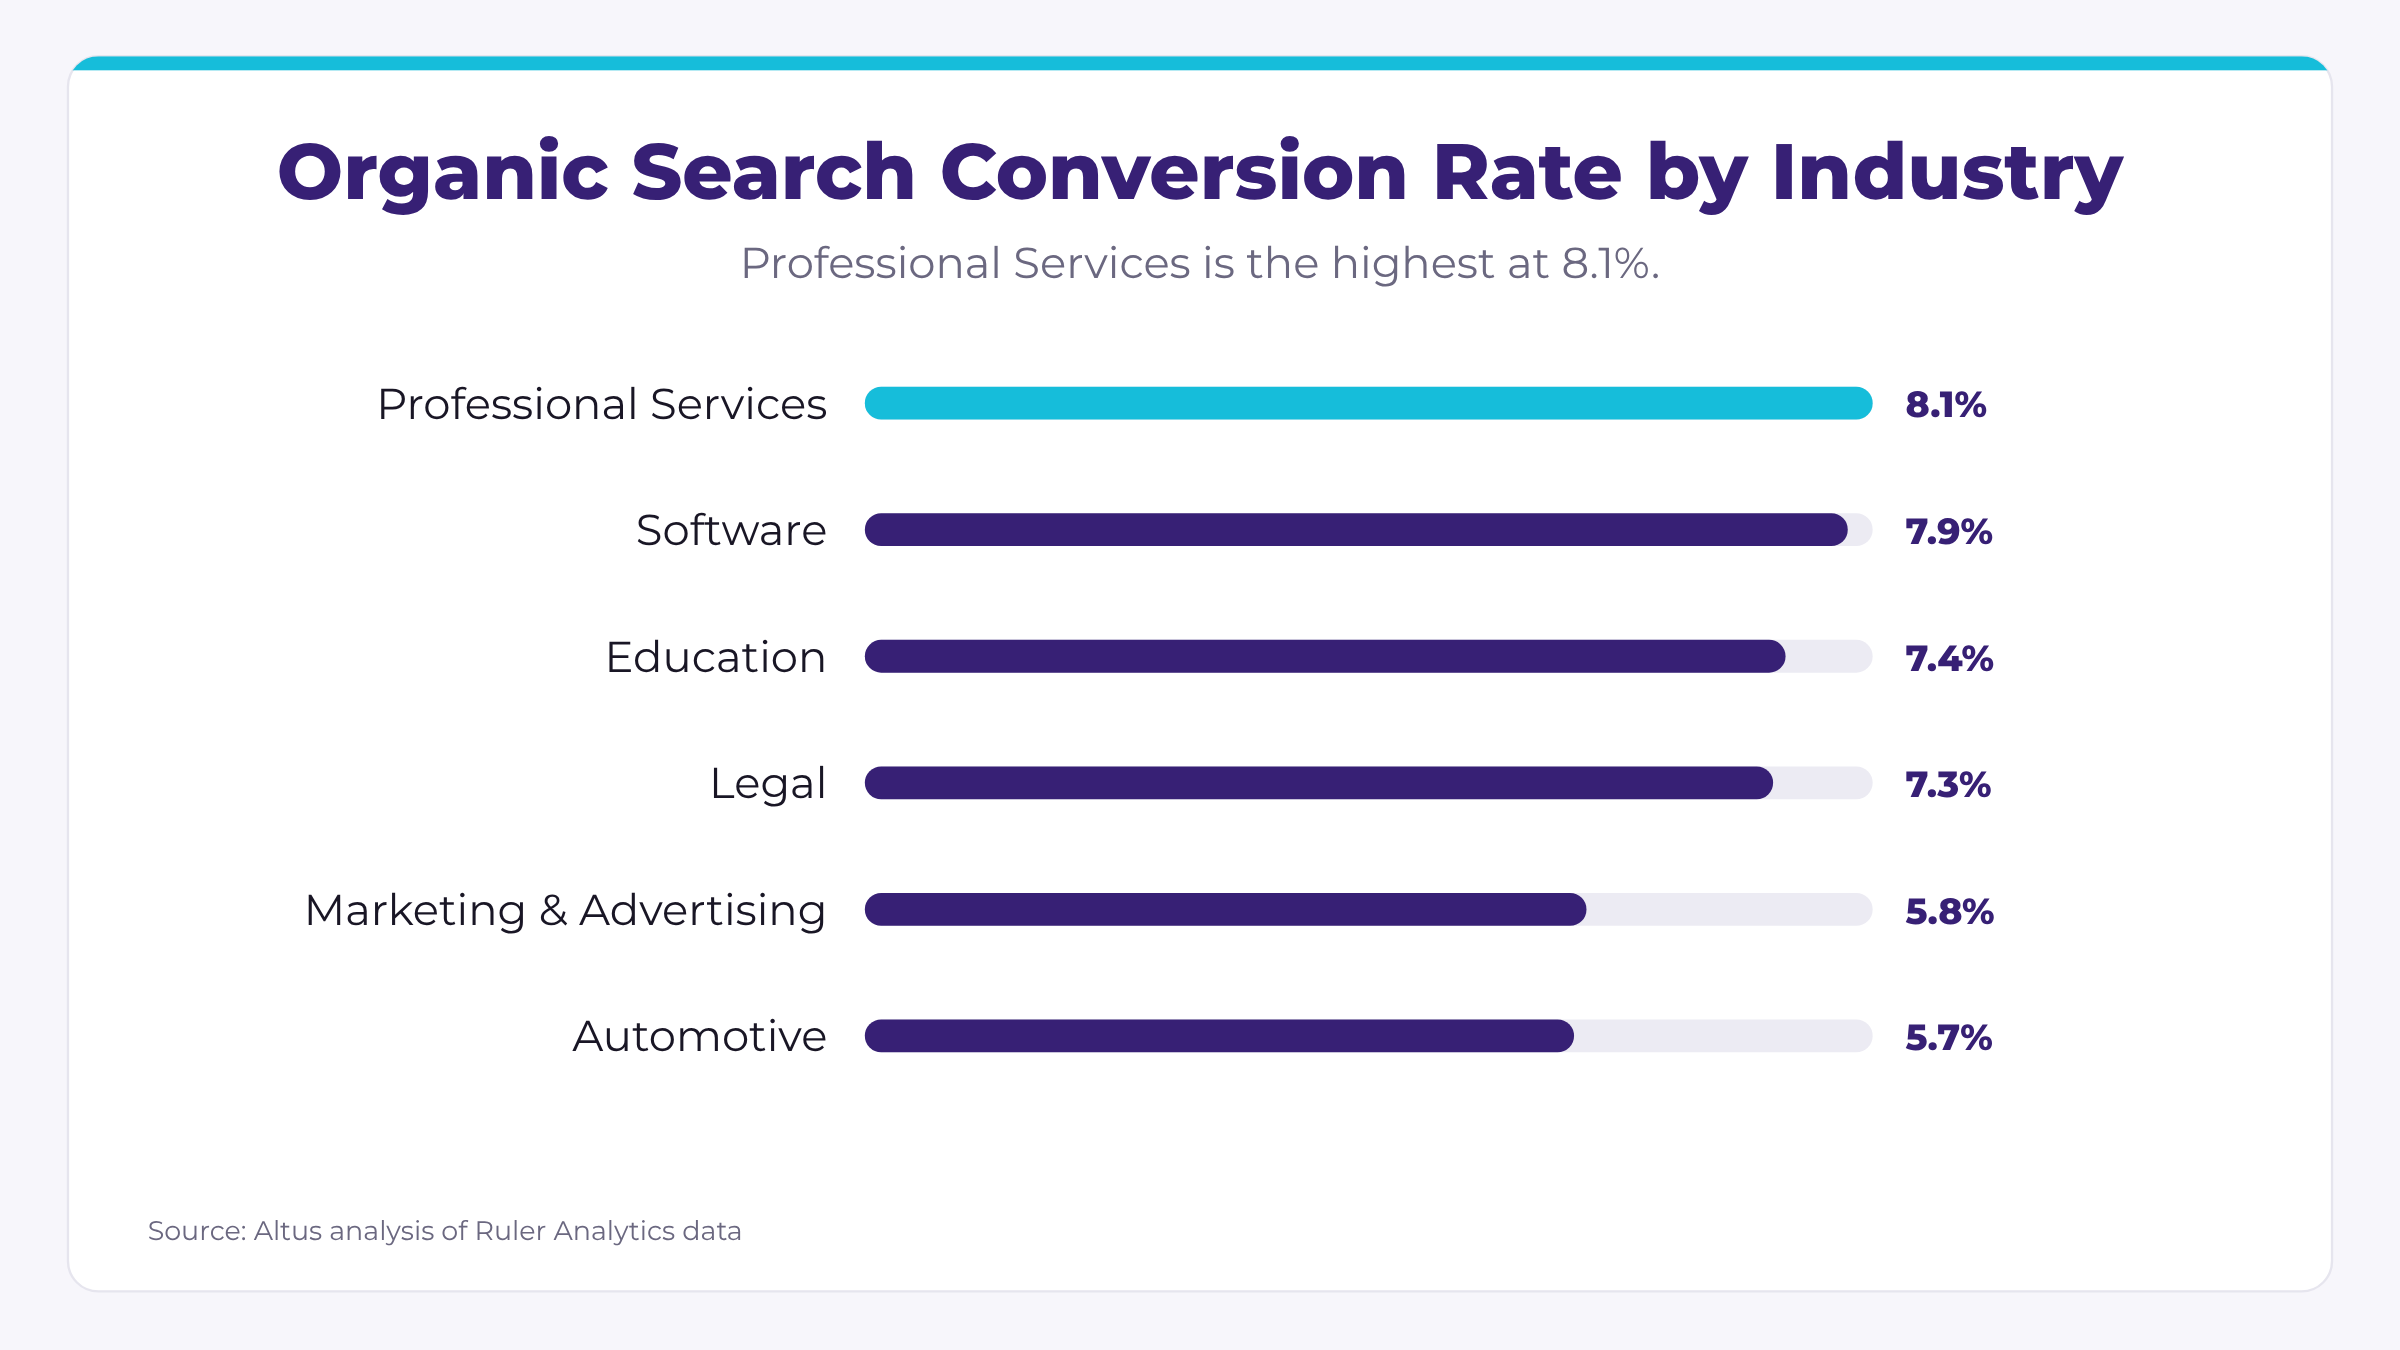
Organic Search Conversion Rate by Industry
The chart and table below rank all 13 industries by organic search conversion rate and show how each compares with paid search and with the industry’s all-channel average. Leads per 1,000 organic visits is the conversion rate multiplied by 10.
| Industry | Organic Search | Paid Search | All Channels | Leads per 1,000 Organic Visits |
|---|---|---|---|---|
| Professional Services | 8.1% | 6.7% | 6.1% | 81 |
| Software | 7.9% | 8.2% | 7.6% | 79 |
| Education | 7.4% | 5.7% | 6.3% | 74 |
| Legal | 7.3% | 7.8% | 7.9% | 73 |
| Marketing & Advertising | 5.8% | 8.9% | 6.2% | 58 |
| Automotive | 5.7% | 8.6% | 7.9% | 57 |
| Finance | 5.4% | 6.3% | 6.3% | 54 |
| Construction & Engineering | 4.8% | 5.1% | 4.9% | 48 |
| Beauty & Cosmetic | 3.2% | 4.2% | 3.5% | 32 |
| Real Estate | 2.4% | 3.7% | 2.8% | 24 |
| Retail & eCommerce | 2.0% | 2.1% | 2.4% | 20 |
| Health & Social Care | 1.8% | 1.2% | 2.3% | 18 |
| Travel | 1.8% | 2.2% | 1.9% | 18 |
Organic vs Paid Search Conversion Rates
We subtracted each industry’s paid search conversion rate from its organic search conversion rate. A positive gap means organic visitors convert better than paid visitors.
| Industry | Organic Search | Paid Search | Organic Minus Paid |
|---|---|---|---|
| Education | 7.4% | 5.7% | +1.7 pts |
| Professional Services | 8.1% | 6.7% | +1.4 pts |
| Health & Social Care | 1.8% | 1.2% | +0.6 pts |
| Retail & eCommerce | 2.0% | 2.1% | -0.1 pts |
| Software | 7.9% | 8.2% | -0.3 pts |
| Construction & Engineering | 4.8% | 5.1% | -0.3 pts |
| Travel | 1.8% | 2.2% | -0.4 pts |
| Legal | 7.3% | 7.8% | -0.5 pts |
| Finance | 5.4% | 6.3% | -0.9 pts |
| Beauty & Cosmetic | 3.2% | 4.2% | -1.0 pts |
| Real Estate | 2.4% | 3.7% | -1.3 pts |
| Automotive | 5.7% | 8.6% | -2.9 pts |
| Marketing & Advertising | 5.8% | 8.9% | -3.1 pts |
How Organic Conversion Rates Changed From 2025 to 2026
Ruler Analytics also publishes its 2025 full-year organic search conversion rates. We compared the 5 industries that use the same category name in both years.
| Industry | 2025 Organic Rate | 2026 Organic Rate | Change |
|---|---|---|---|
| Legal | 3.0% | 7.3% | +4.3 pts |
| Professional Services | 5.0% | 8.1% | +3.1 pts |
| Automotive | 4.0% | 5.7% | +1.7 pts |
| Real Estate | 2.2% | 2.4% | +0.2 pts |
| Travel | 1.7% | 1.8% | +0.1 pts |
How These Rates Compare With B2B Benchmarks
First Page Sage publishes sitewide conversion rates for B2B industries. We compared its figures with Ruler’s organic search rates for the five industries that appear in both reports.
| Industry | Ruler Organic Search | First Page Sage B2B Sitewide | Difference |
|---|---|---|---|
| Construction & Engineering / Construction | 4.8% | 1.9% | +2.9 pts |
| Finance / Financial Services | 5.4% | 1.9% | +3.5 pts |
| Legal / Legal Services | 7.3% | 7.4% | -0.1 pts |
| Real Estate / Real Estate | 2.4% | 2.7% | -0.3 pts |
| Software / Software Development | 7.9% | 1.1% | +6.8 pts |
- Organic search converts an average of 4.9% of visits across the 13 industries in our analysis, compared with 5.4% for paid search.
- Professional Services has the highest organic conversion rate at 8.1%, and Health & Social Care and Travel have the lowest at 1.8%.
- Organic outperforms paid search in 3 of 13 industries, led by Education at +1.7 points.
- Organic conversion rates rose in all 5 industries with comparable 2025 data, with Legal up 4.3 points.
- Legal services conversion benchmarks are consistent across sources at about 7.3% to 7.4%.
Methodology
Inputs
- Ruler Analytics, Conversion Rate Benchmarks 2026: organic search, paid search and all-channel conversion rates for 13 industries, based on more than 110 million sessions and 5 million conversions tracked through Ruler’s attribution platform. Ruler defines a conversion as a qualified lead or sale, including both form fills and phone calls. The same page publishes 2025 full-year organic rates by industry.
- First Page Sage, B2B Conversion Rates by Industry 2026: sitewide conversion rates for 25 B2B industries, drawn from First Page Sage’s own dataset collected January 2022 through August 2025.
Calculations
Leads per 1,000 organic visits = organic rate × 10
Change from 2025 = 2026 organic rate − 2025 organic rate
Averages = simple mean of the 13 industry rates
Our simple averages (4.9% organic and 5.4% paid) match the overall figures Ruler reports for organic search (4.9%) and paid search (5.4%), which confirms the industry inputs were transcribed correctly.
Category matching
Industry names follow Ruler’s categories. The 2025 comparison includes only the 5 industries whose category name is identical in both years; Ruler renamed or regrouped other categories (for example, Healthcare became Health & Social Care), so we did not compare them. The First Page Sage comparison pairs Legal with Legal Services, Real Estate with Real Estate, Finance with Financial Services, Construction & Engineering with Construction, and Software with Software Development.
Assumptions and limitations
- Ruler’s data covers the businesses that use its platform. It is not limited to small businesses.
- Ruler uses multi-touch attribution, so a conversion may be credited partly to organic search even if the final visit came from another channel.
- Leads per 1,000 visits assumes the published average rate applies; individual sites vary widely.
- Ruler notes that its 2026 rates are notably higher than in prior years, so year-over-year changes may partly reflect changes in its sample.
- First Page Sage measures sitewide B2B conversion to a known lead, not organic search alone, so the comparison is directional.
Sources
- Rigby, Katie. “Conversion Rate Benchmarks 2026: Based on 5+ Million Conversions Tracked Across 13 Industries.” Ruler Analytics. May 26, 2026. https://www.ruleranalytics.com/blog/insight/conversion-rate-by-industry/
- Bailyn, Evan. “B2B Conversion Rates By Industry, 2026.” First Page Sage. September 18, 2025. https://firstpagesage.com/reports/b2b-conversion-rates-by-industry-fc/
If you’d like to request a PDF copy of this report or learn more about our agency, you can reach out here.