From May through September 2026, our research team used a weighted model to anchor marketing channel costs for new clients to 2025 and 2026 contractor benchmark datasets, effectively covering thousands of plumbing ad accounts, and adjusting every state by local market costs and plumber wage data to show where the trend is pushing up or down.
In the sections below, we break down plumber customer acquisition cost by state, by region, and by marketing channel, along with how long it takes a plumbing business to earn that cost back.
Average Customer Acquisition Cost for Plumbers by State: 2026
| Rank | State | Cost per Client | Vs. U.S. Avg. | Cost of Living | Plumber Wage | Biggest Cost Driver |
|---|---|---|---|---|---|---|
| 1 | Hawaii | $403 | +35.7% | 185.0 | $41.02 | Higher local market costs |
| 2 | Massachusetts | $362 | +21.9% | 141.2 | $42.02 | Higher local market costs |
| 3 | District of Columbia | $355 | +19.5% | 138.8 | $40.31 | Higher local market costs |
| 4 | California | $351 | +18.2% | 142.3 | $37.67 | Higher local market costs |
| 5 | New York | $342 | +15.2% | 125.1 | $40.63 | Higher local market costs |
| 6 | Alaska | $341 | +14.8% | 124.9 | $40.46 | Higher local market costs |
| 7 | Oregon | $339 | +14.1% | 111.8 | $44.46 | Higher technician labor cost |
| 8 | New Jersey | $338 | +13.8% | 115.1 | $42.94 | Higher technician labor cost |
| 9 | Washington | $334 | +12.5% | 114.1 | $42.00 | Higher technician labor cost |
| 10 | Illinois | $317 | +6.7% | 94.7 | $42.87 | Higher technician labor cost |
| 11 | Maryland | $312 | +5.1% | 115.4 | $33.65 | Higher local market costs |
| 12 | Wisconsin | $312 | +5.1% | 97.7 | $39.91 | Higher technician labor cost |
| 13 | Rhode Island | $311 | +4.7% | 110.6 | $34.98 | Higher local market costs |
| 14 | Connecticut | $309 | +4.0% | 112.7 | $33.42 | Higher local market costs |
| 15 | Minnesota | $309 | +4.0% | 94.6 | $40.13 | Higher technician labor cost |
| 16 | Maine | $304 | +2.4% | 113.0 | $31.61 | Higher local market costs |
| 17 | Arizona | $304 | +2.4% | 110.7 | $32.22 | Higher local market costs |
| 18 | Vermont | $301 | +1.3% | 113.6 | $30.40 | Higher local market costs |
| 19 | New Hampshire | $300 | +1.0% | 111.4 | $30.81 | Higher local market costs |
| 20 | Pennsylvania | $299 | +0.7% | 97.2 | $35.55 | Higher technician labor cost |
| 21 | Colorado | $296 | -0.3% | 102.7 | $32.22 | Near national norms on both inputs |
| 22 | Montana | $296 | -0.3% | 95.5 | $35.15 | Lower local market costs |
| 23 | Nevada | $293 | -1.3% | 100.2 | $32.39 | Near national norms on both inputs |
| 24 | Delaware | $292 | -1.7% | 101.9 | $31.36 | Lower technician labor cost |
| 25 | Michigan | $291 | -2.0% | 90.1 | $35.02 | Lower local market costs |
| 26 | Utah | $289 | -2.7% | 102.2 | $30.10 | Lower technician labor cost |
| 27 | Nebraska | $288 | -3.0% | 92.6 | $33.01 | Lower local market costs |
| 28 | Ohio | $287 | -3.4% | 94.3 | $32.18 | Lower local market costs |
| 29 | Indiana | $287 | -3.4% | 91.0 | $33.42 | Lower local market costs |
| 30 | Missouri | $286 | -3.7% | 89.0 | $33.84 | Lower local market costs |
| 31 | Kentucky | $284 | -4.4% | 92.5 | $31.97 | Lower local market costs |
| 32 | Kansas | $284 | -4.4% | 88.8 | $33.03 | Lower local market costs |
| 33 | Virginia | $283 | -4.7% | 100.8 | $28.28 | Lower technician labor cost |
| 34 | Idaho | $282 | -5.1% | 99.9 | $28.42 | Lower technician labor cost |
| 35 | North Dakota | $282 | -5.1% | 91.4 | $31.62 | Lower local market costs |
| 36 | Wyoming | $280 | -5.7% | 93.7 | $29.84 | Lower technician labor cost |
| 37 | Louisiana | $279 | -6.1% | 92.3 | $30.06 | Lower technician labor cost |
| 38 | Iowa | $279 | -6.1% | 89.7 | $31.18 | Lower local market costs |
| 39 | New Mexico | $278 | -6.4% | 93.7 | $29.37 | Lower technician labor cost |
| 40 | Florida | $277 | -6.7% | 102.2 | $25.79 | Lower technician labor cost |
| 41 | Georgia | $275 | -7.4% | 92.5 | $28.59 | Lower technician labor cost |
| 42 | Texas | $275 | -7.4% | 92.1 | $28.61 | Lower technician labor cost |
| 43 | North Carolina | $273 | -8.1% | 97.8 | $26.02 | Lower technician labor cost |
| 44 | Tennessee | $273 | -8.1% | 90.3 | $28.57 | Lower technician labor cost |
| 45 | South Carolina | $272 | -8.4% | 94.7 | $26.63 | Lower technician labor cost |
| 46 | South Dakota | $268 | -9.8% | 91.9 | $26.48 | Lower technician labor cost |
| 47 | Mississippi | $267 | -10.1% | 87.3 | $27.64 | Lower technician labor cost |
| 48 | West Virginia | $266 | -10.4% | 88.3 | $26.79 | Lower technician labor cost |
| 49 | Alabama | $265 | -10.8% | 88.6 | $26.31 | Lower technician labor cost |
| 50 | Oklahoma | $265 | -10.8% | 86.0 | $27.35 | Lower technician labor cost |
| 51 | Arkansas | $261 | -12.1% | 89.6 | $24.82 | Lower technician labor cost |
A plumber in Hawaii pays roughly 54% more to win a client than a plumber in Arkansas, a gap driven mostly by local market costs rather than ad strategy. Labor costs also matter: Oregon, Illinois, and Wisconsin rank well above their cost of living because technician wages there run about $40 to $44 an hour ($39.91 to $44.46), which makes every unconverted quote more expensive.
Average Customer Acquisition Cost for Plumbers by Region: 2026
Grouping states into the four standard U.S. regions shows that coastal markets carry the heaviest acquisition burden. The two explanation columns show each region’s average cost of living index and average plumber wage.
Average Customer Acquisition Cost for Plumbers by Channel: 2026
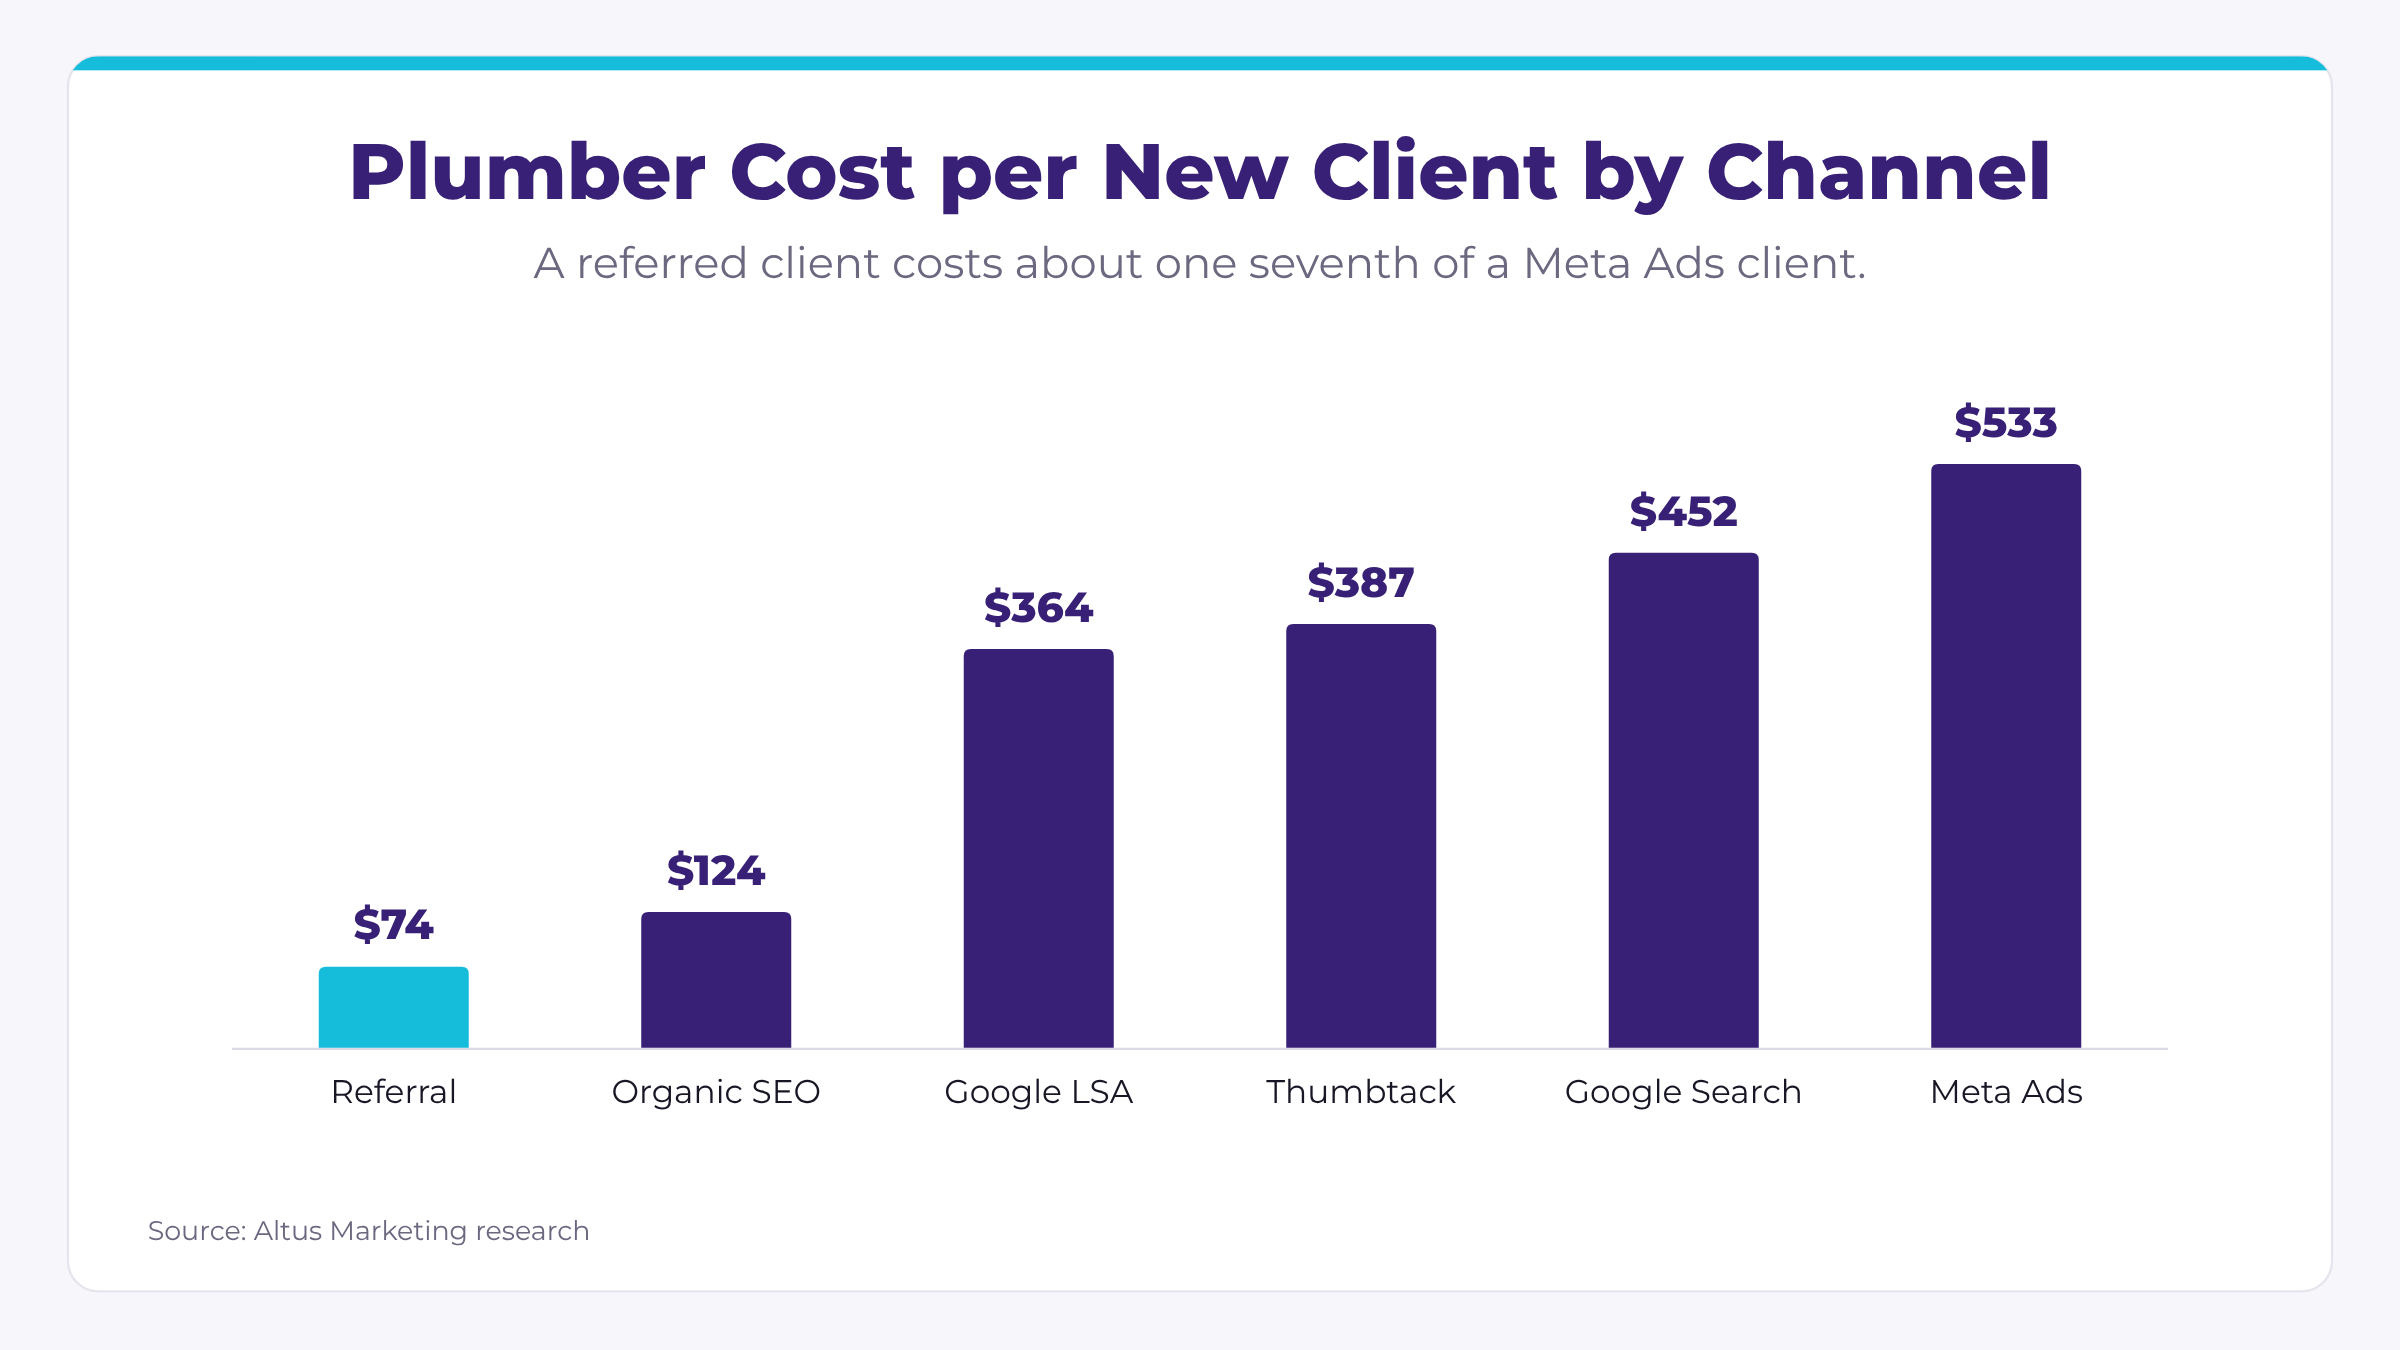
Channel choice moves acquisition cost far more than geography does. Total cost per client combines the ad or marketing cost to produce one paying client with the consultation time (intake calls, quotes, and follow-ups at a $43.72 loaded hourly rate) spent across every lead it takes to close one.
| Channel | Lead-to-Client Rate |
|---|---|
| Referral programs | 55% |
| Organic SEO and Google Business Profile | 35% |
| Google Local Services Ads | 22% |
| Thumbtack | 16% |
| Google Search Ads (non-branded) | 18% |
| Meta (Facebook and Instagram) Ads | 15% |
| Angi | 10% |
Average Plumber CAC Payback: 2026
Payback shows how fast each channel recovers its acquisition cost from the work a new client brings in. Our model assumes a $450 average service appointment at a 50% gross margin ($225 of gross profit per visit) and 1.5 visits per client per year, or one visit roughly every eight months.
| Channel | Cost per Client | Visits to Earn Back | Months to Earn Back | Revenue per $1 | Lifetime Revenue | Why It Pays Back at This Speed |
|---|---|---|---|---|---|---|
| Referral programs | $74 | 0.3 | First visit | $42.32 | $3,132 | Referred clients spend more and stay longer |
| Organic SEO and Google Business Profile | $124 | 0.6 | First visit | $22.86 | $2,835 | Low cost plus clients who chose you through reviews |
| Google Local Services Ads | $364 | 1.6 | 4.9 | $7.42 | $2,700 | High-intent calls that often convert on emergency work |
| Thumbtack | $387 | 1.7 | 5.8 | $5.58 | $2,160 | Price-shopping clients show weaker repeat loyalty |
| Google Search Ads (non-branded) | $452 | 2.0 | 8.1 | $5.97 | $2,700 | Solid client value, but the higher entry cost needs a second visit |
| Meta (Facebook and Instagram) Ads | $533 | 2.4 | 11.0 | $4.56 | $2,430 | Slower conversions and lower urgency jobs |
| Angi | $761 | 3.4 | 19.1 | $2.84 | $2,160 | Highest cost and the least loyal clients |
Conclusion
The biggest trend in our findings is that channel mix outweighs geography: the gap between the cheapest and most expensive channel is $687, which is nearly five times the gap of $142 between the cheapest and most expensive state. Exclusive, high-trust channels like referrals, organic search, and Local Services Ads keep both ad costs and quoting time low, while shared-lead marketplaces quietly inflate acquisition costs through lost quotes. Plumbers in high-cost states like Hawaii, Massachusetts, and California cannot change their local market, but they can shift budget toward owned channels and retention programs that shorten payback and protect margins as paid search costs keep rising.
- Channel mix outweighs geography
- Exclusive, high-trust channels like referrals, organic search, and Local Services Ads keep both ad costs and quoting time low
- Shared-lead marketplaces quietly inflate acquisition costs through lost quotes
If you need help lowering your client acquisition cost, or just want a PDF copy of this report, contact Altus.
Sources
- What Is a Good Cost Per Lead for Plumbing Google Ads? (2026 Benchmarks)
Author: Jon Torrey
Publication: SearchLight Digital
Date: April 1, 2026
URL: https://searchlightdigital.io/plumbing-google-ads-cost-per-lead/ - What Is a Good Cost Per Lead for Google Local Service Ads? (2026 Benchmarks)
Author: Jon Torrey
Publication: SearchLight Digital
Date: March 9, 2026
URL: https://searchlightdigital.io/google-local-service-ads-cost-per-lead/ - Home Services Advertising Benchmarks (+9 Ideas for Better Results)
Author: Stephanie Heitman
Publication: LocaliQ
Date: February 23, 2026
URL: https://localiq.com/blog/home-services-advertising-benchmarks/ - Plumbing Leads in 2026
Author: PipelineOn Research Team
Publication: PipelineOn
Date: June 5, 2026
URL: https://pipelineon.com/blog/plumbing-leads/ - Plumbing Marketing in 2026
Author: PipelineOn Research Team
Publication: PipelineOn
Date: June 5, 2026
URL: https://pipelineon.com/blog/plumbing-marketing/ - Effective Reporting and Plumbing Marketing Tools and Techniques
Author: Smart Service
Publication: Smart Service
Date: 2026
URL: https://www.smartservice.com/blog/plumbing-reporting-marketing - PPC vs. SEO for Plumbers: Which Delivers the Lowest Cost-Per-Lead?
Author: BizIQ
Publication: BizIQ
Date: 2026
URL: https://biziq.com/blog/ppc-vs-seo-for-plumbers-which-delivers-the-lowest-cost-per-lead/ - How to Use Google Ads to Grow Your Plumbing Business
Author: Ann Schreiber
Publication: Housecall Pro
Date: March 23, 2026
URL: https://www.housecallpro.com/resources/google-ads-for-plumbers/ - Digital Marketing Strategy Adoption & ROI in Plumbing: 42+ Key Stats (2026)
Author: Cedric Pharand
Publication: Webtonic
Date: October 9, 2026
URL: https://www.webtonic.io/blog/plumbing-digital-marketing-statistics - What a New Customer Is Actually Worth to Your Service Business (And Why It Changes Everything)
Author: The Valley Marketing Group
Publication: The Valley Marketing Group
Date: September 8, 2026
URL: https://thevalleymarketinggroup.com/blog/customer-lifetime-value-marketing-budget-service-business/ - How Much Do Plumbers Make in the United States? [2026 Plumber Salary Guide]
Author: Seth Richtsmeier
Publication: Jobber
Date: April 19, 2026
URL: https://www.getjobber.com/academy/plumbing/how-much-do-plumbers-make/ - Cost of Living Index by State 2026
Author: World Population Review
Publication: World Population Review
Date: October 14, 2026
URL: https://worldpopulationreview.com/state-rankings/cost-of-living-index-by-state