From February through September 2026, our research team used a weighted model to anchor marketing channel costs for new clients to 2025 and 2026 pest control industry benchmark datasets that together cover thousands of ad accounts, adjusting for local price levels and the channel mix pest control companies actually use.
In the sections below, we break down pest control customer acquisition costs by state, by lead source, by business size, and by market type, and include a payback model showing how long it takes to earn back your marketing spend on a typical service agreement.
Average CAC for Pest Control Companies by State: 2026
Pest control costs vary by state, driven by local price levels, competition, and the cost of digital advertising in each market. In our model, each state’s CAC is the $275 national weighted average multiplied by its 2024 regional price parity from the BEA, so states with higher overall costs carry higher acquisition costs.
| State | Avg. CAC | Vs. U.S. Avg. |
|---|---|---|
| Alabama | $244 | -11% |
| Alaska | $281 | +2% |
| Arizona | $277 | +1% |
| Arkansas | $239 | -13% |
| California | $304 | +11% |
| Colorado | $283 | +3% |
| Connecticut | $285 | +4% |
| Delaware | $274 | 0% |
| Florida | $284 | +3% |
| Georgia | $265 | -4% |
| Hawaii | $302 | +10% |
| Idaho | $263 | -4% |
| Illinois | $275 | 0% |
| Indiana | $257 | -7% |
| Iowa | $241 | -12% |
| Kansas | $248 | -10% |
| Kentucky | $248 | -10% |
| Louisiana | $243 | -12% |
| Maine | $267 | -3% |
| Maryland | $289 | +5% |
| Massachusetts | $291 | +6% |
| Michigan | $265 | -4% |
| Minnesota | $271 | -1% |
| Mississippi | $239 | -13% |
| Missouri | $250 | -9% |
| Montana | $260 | -5% |
| Nebraska | $248 | -10% |
| Nevada | $275 | 0% |
| New Hampshire | $286 | +4% |
| New Jersey | $299 | +9% |
| New Mexico | $254 | -8% |
| New York | $297 | +8% |
| North Carolina | $259 | -6% |
| North Dakota | $245 | -11% |
| Ohio | $255 | -7% |
| Oklahoma | $242 | -12% |
| Oregon | $284 | +3% |
| Pennsylvania | $268 | -3% |
| Rhode Island | $281 | +2% |
| South Carolina | $258 | -6% |
| South Dakota | $244 | -11% |
| Tennessee | $253 | -8% |
| Texas | $267 | -3% |
| Utah | $272 | -1% |
| Vermont | $269 | -2% |
| Virginia | $278 | +1% |
| Washington | $294 | +7% |
| West Virginia | $246 | -11% |
| Wisconsin | $259 | -6% |
| Wyoming | $255 | -7% |
- Southern states show the lowest CAC, with Arkansas and Mississippi at $239 and Oklahoma, Louisiana, and Alabama all under $245, reflecting lower local price levels
- California ($304), Hawaii ($302), New Jersey ($299), and New York ($297) sit at the top of the range, where higher local costs push up the price of every new client
- Texas ($267) and Georgia ($265) sit below the national average despite their size, while Florida ($284) runs slightly above it
- Midwestern markets cluster in the $241-$275 range, offering a reliable mid-tier CAC
Average CAC for Pest Control Companies by Lead Source: 2026
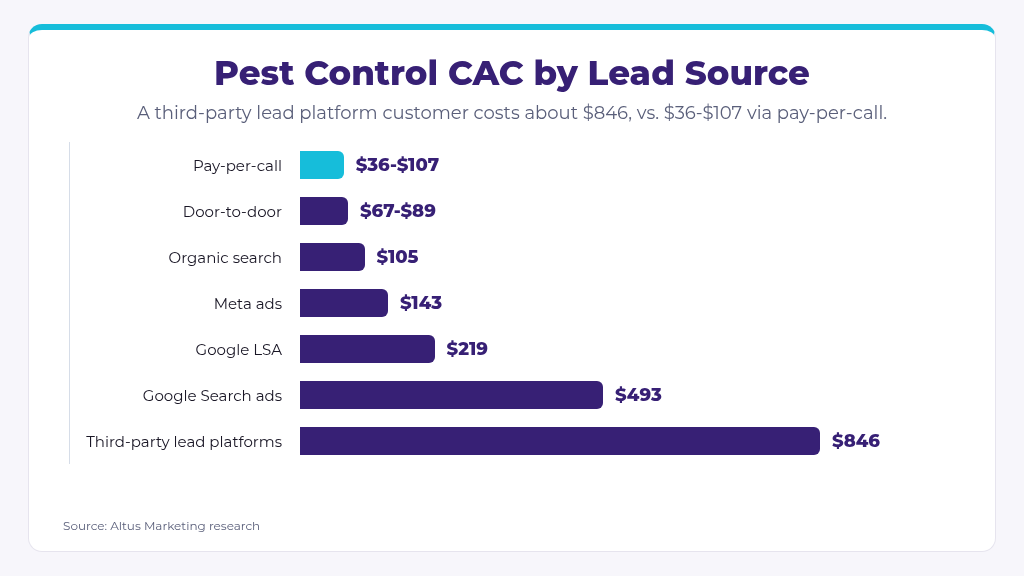
Not all leads cost the same or convert at the same rate. The channel mix a pest control company uses has a significant effect on blended CAC, and the right mix depends heavily on service area density and whether the business is selling one-time treatments or recurring service agreements. Our analysis divides each channel’s published cost per lead by its published close or booking rate.
| Lead Source | Cost per Lead | Close or Booking Rate | Inputs |
|---|---|---|---|
| Pay-per-call | $15-$45 per qualified call | 42% | CallScaler pricing; ServiceTitan booking rate |
| Door-to-door | $67-$89 per customer, all-in | 3-5% of doors | Cube Creative model, commissions and vehicle included |
| Organic search and Google Business Profile | $44 | 42% | Coalmarch; ServiceTitan |
| Facebook/Meta Ads | $42.95 | 30% (assumed) | LocaliQ home improvement CPL; paid search close rate applied |
| Google LSA | $96 | 43.9% | Coalmarch; SearchLight via Amir Gomez |
| Google Ads (PPC) | $148 | 30% | Coalmarch; Marketing Exterminator |
| Third-party lead platforms | $55 (midpoint of $10-$100) | 10% of the 65% that are qualified | Housecall Pro, Elevarus, PipelineOn via Marketing Exterminator |
- Pay-per-call and door-to-door post the lowest cost per customer, though door-to-door depends on labor and commissions rather than ad budget
- Organic search delivers the lowest CAC of the scalable digital channels at $105 and compounds over time, making it the highest-ROI investment for companies building long-term pipelines
- Google LSAs perform well for pest control because the service category maps cleanly to local intent searches, and the verified badge improves click-through rates
- Third-party lead platforms carry the highest CAC in this category at about $846, because shared leads convert at only 5-15%; Google Search ads follow at $493
Average CAC for Pest Control Companies by Business Size: 2026
Larger pest control operations benefit from brand recognition, route density, and more sophisticated marketing infrastructure. ServiceTitan’s call data shows shops with 25+ technicians book 59% of calls versus 24% for shops under 5. Our analysis applies those booking rates to the same $101 blended cost per lead.
| Business Size | Call Booking Rate | Avg. CAC |
|---|---|---|
| Under 5 technicians | 24% | $420 |
| All shops (median) | 42% | $240 |
| 25+ technicians | 59% | $171 |
- Smaller shops pay the most per customer, not because their leads cost more, but because they book fewer of the calls they pay for
- Moving from a 24% to a 59% booking rate cuts CAC from $420 to $171 at the same cost per lead
- Larger operations answer more calls and respond faster, which ServiceTitan’s data shows matters more than ad spend
- For companies under 15 techs, improving lead response and call booking is often the fastest CAC improvement available
Average CAC for Pest Control Companies by Market Type: 2026
Urban and rural pest control markets behave very differently. Cube Creative’s pricing data puts leads at $20-$35 in low-competition markets and $60-$80 in high-competition metros, and Coalmarch’s monthly data shows Google Ads lead costs moving from $126 in August to $241 in December. Our analysis divides the market figures by the 36.6% blended close rate and the monthly figures by the 30% paid search close rate.
| Market or Season | Cost per Lead | Avg. CAC |
|---|---|---|
| Low-competition market | $20-$35 | $55-$96 |
| High-competition metro | $60-$80 | $164-$218 |
| Google Ads, August (lowest month) | $126 | $420 |
| Google Ads, December (highest month) | $241 | $803 |
- Low-competition markets achieve the lowest CAC, at roughly a third of what high-competition metros pay per new client
- Dense metro markets push CAC above $160 because national franchise brands compete aggressively in paid search, raising CPCs for every operator in the market
- Season matters as much as geography: the same Google Ads campaign costs nearly twice as much per customer in December as in August
- Building organic visibility in the off-season helps operators avoid paying peak prices for paid clicks
Payback Period on Pest Control Customer Acquisition Cost: 2026
Understanding CAC in isolation only tells half the story. For pest control companies, the recurring nature of service agreements makes the payback calculation more favorable than the headline number suggests. A client who signs a quarterly service agreement generates revenue across multiple visits, so a $275 acquisition cost is recovered within the first year and repaid several times over the life of the plan.
The figures below use Cube Creative’s $440 per year quarterly plan and $2,600 lifetime revenue over 5.5 years, and apply the 58% industry gross margin from the NPMA and PCO Bookkeepers 2025 Cost Study, all compiled by Marketing Exterminator.
| Metric | Value |
|---|---|
| Average CAC | $275 |
| Average First-Year Revenue Per Client | $440 |
| Gross Profit Margin | 58% |
| Gross Profit Per Client (Year 1) | $255 |
| Months to Earn Back CAC | 12.9 |
| Revenue Per $1 of Marketing Spend (Year 1) | $1.60 |
| Average Customer Lifetime | 5.5 years |
| Lifetime Gross Profit to CAC | 5.5:1 |
Conclusion
- Our analysis puts the national weighted average CAC for pest control in 2026 at $275, with variation by state, market type, and the channel mix a business relies on
- Southern and low-competition markets show the lowest CAC, while California, Hawaii, and dense metros push costs higher
- Organic search and LSAs remain the strongest scalable digital channels; third-party lead platforms are the most expensive way to win a customer
- Business size is a real driver of CAC: larger shops book far more of their calls, which cuts cost per customer by more than half
- The recurring service model is the single biggest advantage pest control has in the payback equation: at a 58% gross margin and a 5.5-year average lifetime, each customer returns about 5.5 times their acquisition cost
If you need help lowering your customer acquisition cost, or just want a PDF copy of this report, contact Altus.
Sources
- Regional Price Parities by State and Metro Area, 2024
Author: U.S. Bureau of Economic Analysis
Publication: U.S. Bureau of Economic Analysis
Date: February 19, 2026
URL: https://www.bea.gov/data/prices-inflation/regional-price-parities-state-and-metro-area - Pest Control Marketing ROI: Channel Performance Rankings
Author: Adam Bennett
Publication: Cube Creative
Date: April 2026
URL: https://cubecreative.design/blog/pest-control-marketing/channel-performance-roi-rankings - CAC Benchmark for Home Services Businesses 2026
Author: Amir Gomez
Publication: AmirGomez.com
Date: August 14, 2026
URL: https://www.amirgomez.com/blog/cac-benchmark-home-services-businesses-2026 - Pest Control Lead Economics: Cost Per Lead, Close Rate and CAC Benchmarks by Channel (2026)
Author: Yash Pandit
Publication: Marketing Exterminator
Date: Updated October 9, 2026
URL: https://marketingexterminator.com/pest-control-lead-economics-benchmarks/