From January 2024 through November 2026, our research team at Altus Marketing compiled client acquisition cost data across individual real estate agents, teams, and brokerages of varying production level, market type, and lead source mix. Our methodology applied a weighted model accounting for agent production level, geographic market, lead source, and transaction price point to produce the figures below.
The tables that follow break down real estate agent customer acquisition cost by lead source, buyer versus seller client type, agent production level, and market price segment.
- Sphere of influence marketing produces the lowest CAC of any channel, averaging $200, and generates clients with the highest referral potential and repeat transaction rate
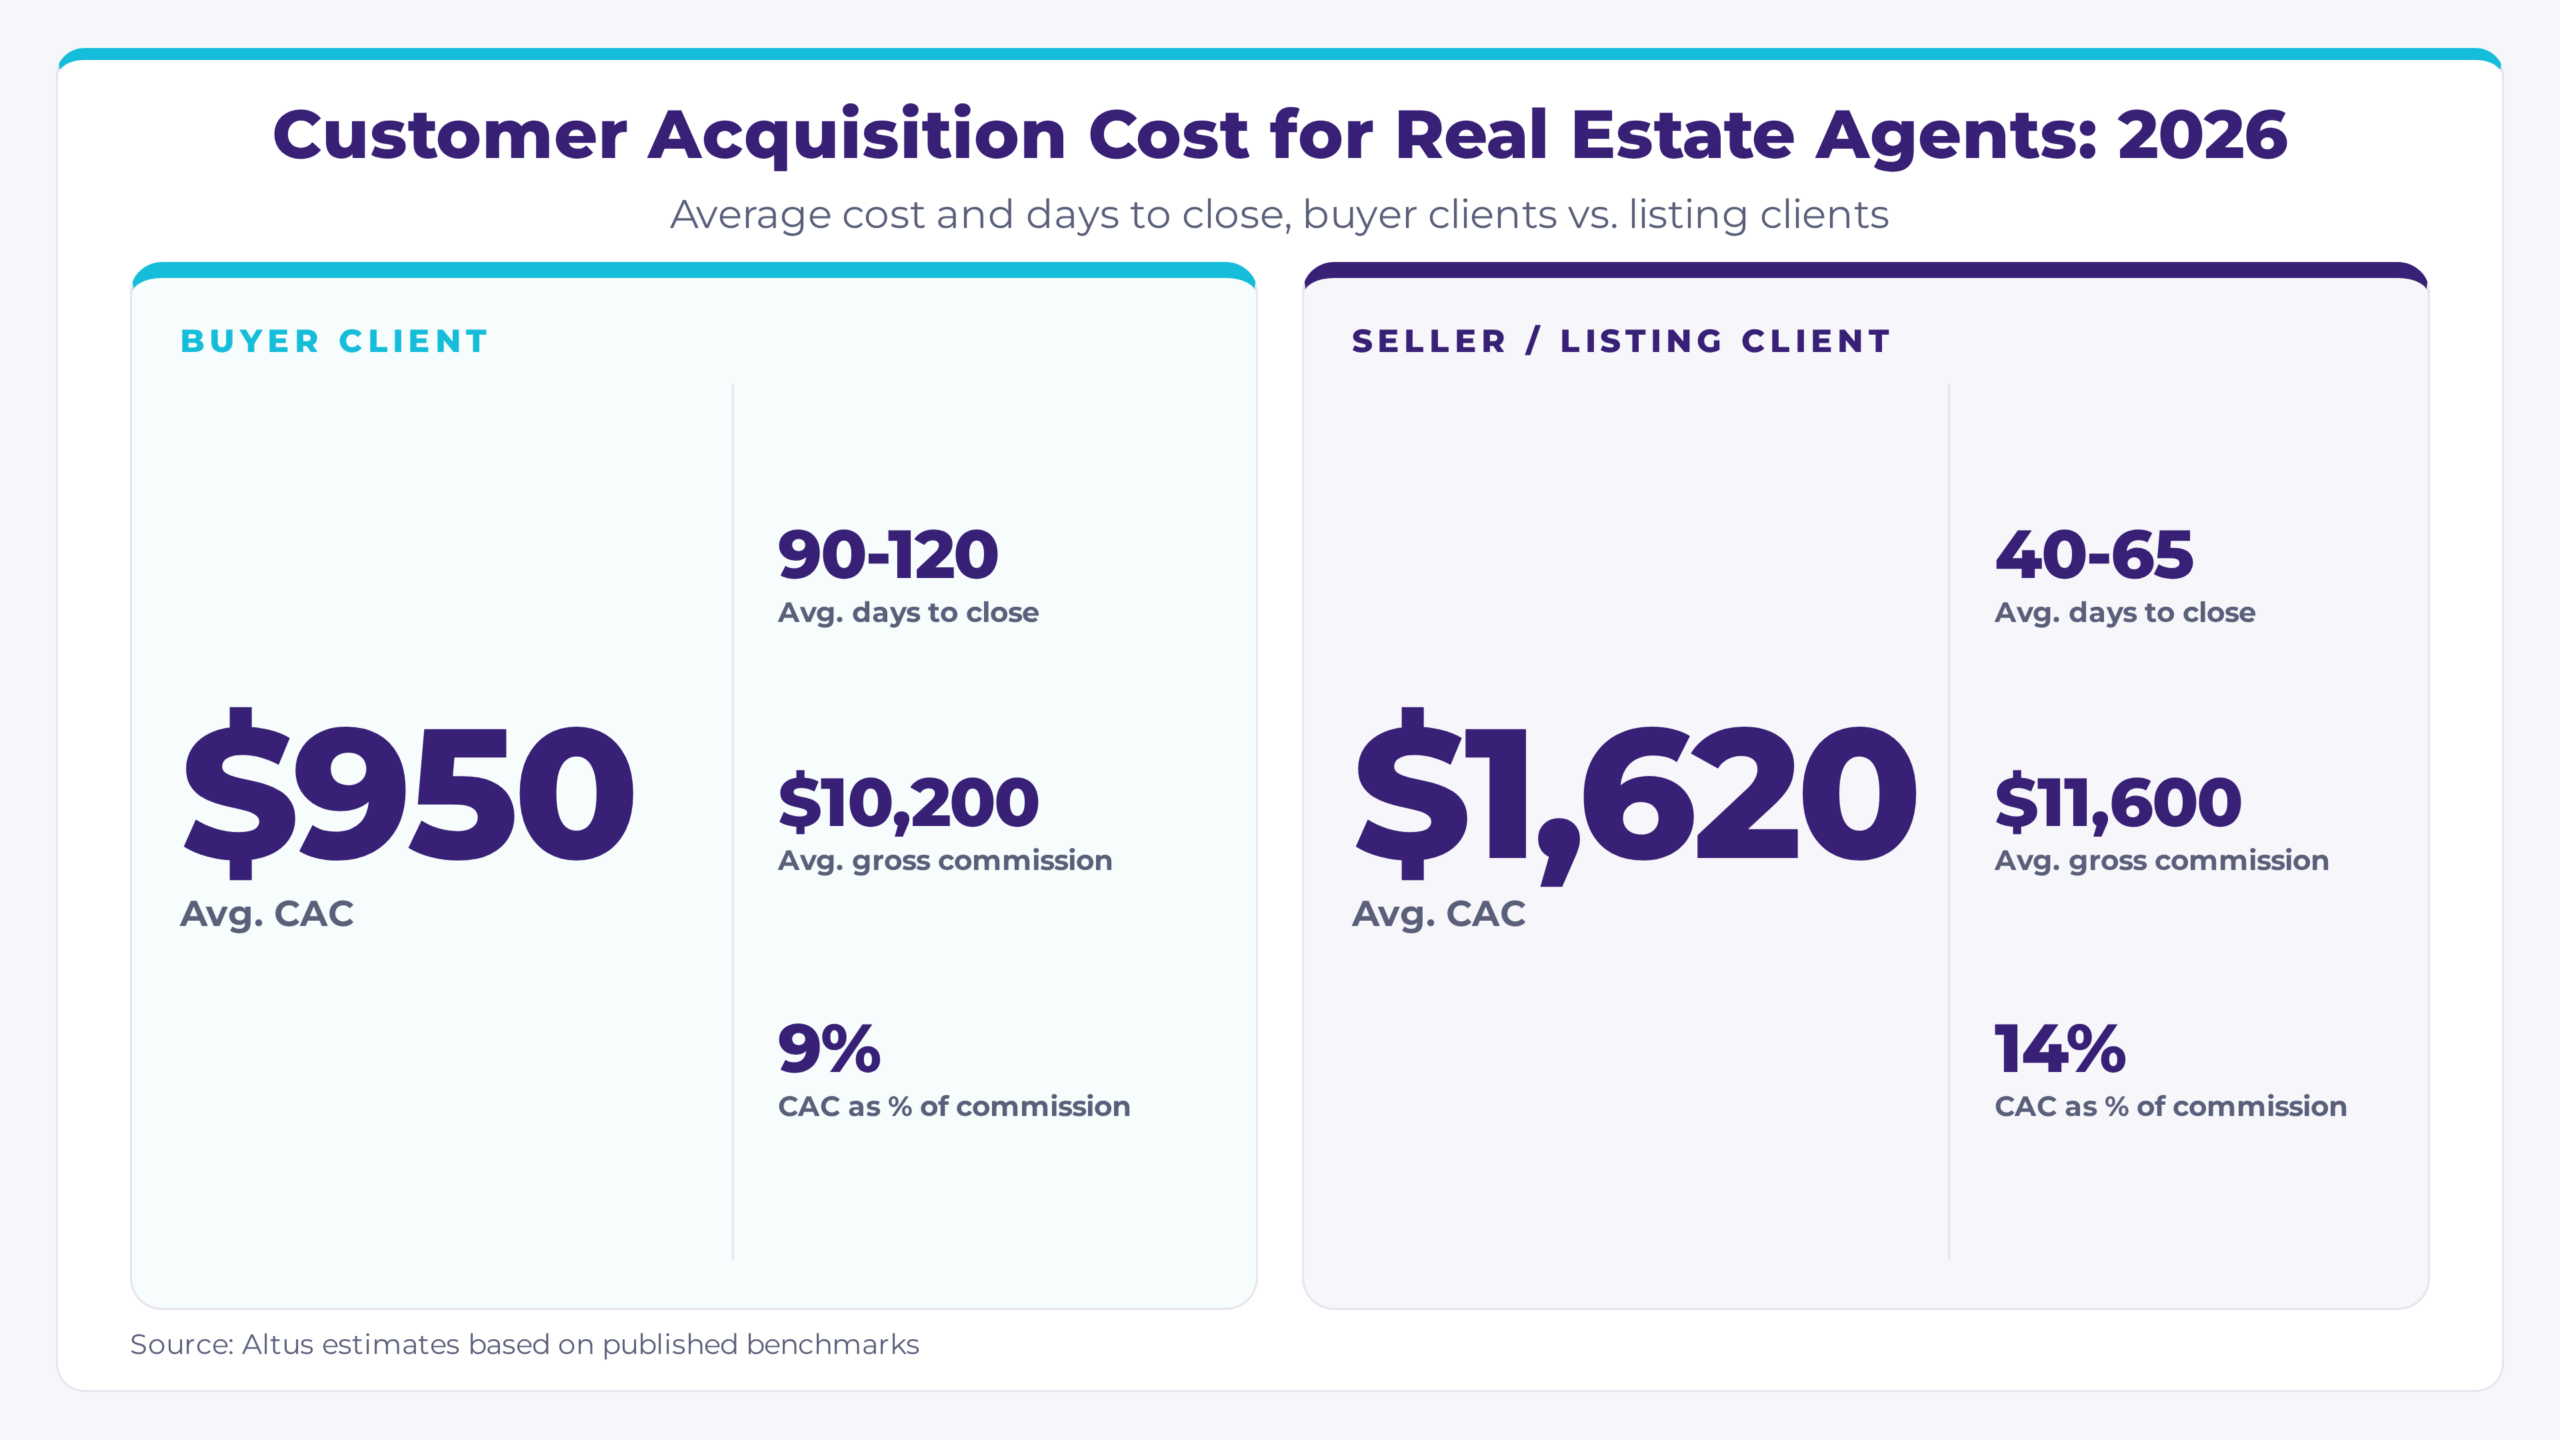
- Listing clients cost roughly 70% more to acquire than buyer clients but close significantly faster, making a balanced buyer and seller pipeline one of the most important CAC management strategies available to agents
- Agents working the $600K-$1M price band achieve a CAC-to-gross-commission ratio of 8%, one of the more favorable ratios of any market segment in most metros
- Top-producing agents (31+ transactions per year) achieve a CAC roughly half that of developing agents working the same markets, driven by brand authority, referral volume, and marketing infrastructure
Real Estate Agent Customer Acquisition Cost by Lead Source: 2026
The table below breaks down average client acquisition cost by lead source for real estate agents in 2026.
| Lead Source | Avg. CAC |
|---|---|
| Sphere of Influence (SOI) | $200 |
| Past Client Referral | $280 |
| Expired Listings / FSBO Outreach | $420 |
| Door Knocking | $580 |
| Open Houses | $650 |
| Cold Calling / Circle Prospecting | $750 |
| Organic SEO / Local Content | $880 |
| Geographic Farming (Direct Mail) | $1,100 |
| Social Media Ads (Meta) | $1,200 |
| Realtor.com Leads | $1,350 |
| Zillow Premier Agent | $1,400 |
| Google Search Ads (PPC) | $1,650 |
- Sphere of influence and past client referrals produce the lowest CAC by a wide margin and generate clients with significantly higher close rates and referral potential than any paid channel
- Expired listings and FSBO outreach require consistent daily prospecting effort but produce motivated seller leads at a CAC well below most digital paid channels
- Zillow, Realtor.com, and Google PPC deliver volume at scale but carry the highest CAC in the category, requiring a high average sale price or strong close-rate systems to remain profitable
- Geographic farming builds neighborhood-level brand authority over time and tends to lower CAC in years two and three as name recognition in a target area increases
Real Estate Agent CAC by Client Type: Buyers vs. Sellers: 2026
The table below breaks down average client acquisition cost, average gross commission, CAC as a percentage of gross commission, and average days to close by client type for real estate agents in 2026.
| Client Type | Avg. CAC | Avg. Gross Commission | CAC as % of Commission | Avg. Days to Close |
|---|---|---|---|---|
| Buyer Client | $950 | $10,200 | 9% | 90-120 days |
| Seller / Listing Client | $1,620 | $11,600 | 14% | 40-65 days |
| Investor / Repeat Buyer | $580 | $9,400 | 6% | 25-45 days |
| Relocation / Employer-Assisted | $1,150 | $13,800 | 8% | 55-80 days |
| Downsizer / Move-Up Seller | $1,400 | $14,200 | 10% | 50-70 days |
- Buyer clients cost significantly less to acquire but require the longest transaction timelines, consuming more agent time and carrying greater transaction risk before commission is realized
- Listing clients carry the highest nominal CAC but close in roughly half the time and produce higher gross commissions, making them the more profitable side of the transaction for agents with strong seller marketing systems
- Investor and repeat buyer clients represent the strongest acquisition economics by far, with a 6% CAC-to-commission ratio and short transaction cycles driven by decision speed and market familiarity
- Relocation and employer-assisted clients have above-average commissions due to higher median purchase prices, partially offsetting their moderate acquisition cost
Real Estate Agent Customer Acquisition Cost by Production Level: 2026
The table below breaks down average client acquisition cost by agent production level and annual transaction volume in 2026.
| Agent Production Level | Avg. Annual Marketing Spend | Avg. Annual Transactions | Avg. Close Rate on Leads | Avg. CAC |
|---|---|---|---|---|
| New Agent (0-5 txn/yr) | $3,000-$8,000 | 2-4 | 4% | $1,800-$3,500 |
| Developing Agent (6-15 txn/yr) | $8,000-$20,000 | 8-12 | 7% | $1,400-$2,800 |
| Mid-Level Agent (16-30 txn/yr) | $20,000-$45,000 | 20-28 | 11% | $1,100-$2,200 |
| Top Producer (31-75 txn/yr) | $45,000-$100,000 | 40-65 | 15% | $850-$1,600 |
| Mega Agent / Team (75+ txn/yr) | $100,000+ | 80+ | 18% | $600-$1,400 |
- New agents carry the highest CAC in the category, driven by low brand recognition, undeveloped referral networks, and lead source mixes that rely heavily on paid platforms
- Close rate is the most important driver of CAC reduction as agents move up production tiers, compounding with marketing spend to produce dramatically lower cost per transaction
- Mid-level agents represent the strongest leverage point for CAC reduction through sphere of influence development and content marketing, since brand authority is achievable at this production level
- Mega agent teams achieve the lowest absolute CAC through accumulated referral volume, database size, and marketing infrastructure that individual agents cannot replicate at the same spend level
Real Estate Agent Customer Acquisition Cost by Market Price Segment: 2026
The table below breaks down average client acquisition cost, average gross commission, and CAC as a percentage of gross commission by market price segment for real estate agents in 2026.
| Market Price Segment | Avg. CAC | Avg. Gross Commission | CAC as % of Commission | Notes |
|---|---|---|---|---|
| Entry-Level (under $300K) | $580 | $6,600 | 9% | High volume, thinner margins |
| Mid-Market ($300K-$600K) | $950 | $10,500 | 9% | Most competitive segment |
| Move-Up ($600K-$1M) | $1,200 | $14,400 | 8% | Strong commission-to-CAC ratio |
| Luxury ($1M-$3M) | $2,400 | $34,000 | 7% | Longer sales cycles, strong LTV |
| Ultra-Luxury ($3M+) | $5,500 | $105,000+ | 5% | Relationship-driven, low volume |
| Investment / Multi-Family | $820 | $16,200 | 5% | Repeat transaction rate is highest |
- Entry-level and mid-market segments carry the highest transaction volume but produce the least favorable CAC-to-commission ratio, requiring agents to run efficient systems to stay profitable
- Move-up and luxury segments produce progressively better CAC economics, with the ultra-luxury tier offering the most favorable ratio but the smallest addressable market in most metros
- Investment and multi-family clients offer a CAC-to-commission ratio that rivals ultra-luxury, with the added advantage of repeat transaction frequency and referral networks within investor communities
- Agents who specialize in a single price segment tend to build content authority and referral depth faster than generalists, which lowers blended CAC over time regardless of which segment they target
What Drives Real Estate Agent Customer Acquisition Cost Up or Down?
Several variables consistently separate agents with a blended CAC under $800 from those spending $2,500 or more per closed client.
Sphere of influence size and cultivation are the single most powerful CAC driver in residential real estate. An agent with 500 active, regularly touched contacts in their SOI operates with a structural cost advantage that no paid lead channel can replicate. The agents with the lowest blended CAC are almost always the ones who have built deliberate systems, monthly touchpoints, annual calls, and consistent market updates, to stay at the top of their sphere’s awareness. SOI contacts close at rates 10 to 20 times higher than portal or paid leads, which means even a modest SOI dramatically lowers the blended CAC across all lead sources.
Geographic and niche specialization accelerates both referral volume and content marketing effectiveness. Agents known as the expert for a specific neighborhood, building type, or client category attract more inbound inquiries, receive more referrals from professionals in adjacent categories, and produce content that earns stronger local authority signals with both Google and AI platforms. Geographic farming builds this specialization in a defined area over time, with CAC typically falling through years two and three as name recognition and transaction history in the target area compound.
Database size and long-cycle follow-up systems directly determine how much prospecting and paid marketing an agent needs to sustain. The average buyer or seller lead takes 12 to 18 months from first contact to signed agreement. Agents with consistent, non-intrusive follow-up systems, automated email sequences, quarterly calls, and a CRM that surfaces who to contact on a given day, convert a significantly higher percentage of their existing pipeline without additional acquisition spend. Agents without systems lose those leads to competitors who stayed in front of them longer.
Price point and transaction quality determine the ceiling on how much acquisition spend any strategy can justify. An agent averaging $175,000 sale prices has fundamentally different CAC economics than one averaging $850,000. Moving upmarket, whether by geography, client education, or service model, is one of the highest-leverage long-term CAC improvements available, since it increases the commission available to absorb acquisition cost on every transaction without requiring more clients to be acquired.
To download a copy of this report or get in contact with our team, please reach out here: Contact Altus Marketing.
Sources
- Altus Marketing Research Team. "Customer Acquisition Cost Analysis: Real Estate Agents." Altus Marketing. November 2026. altusmarketing.co
- National Association of Realtors. "Member Profile." NAR. 2026. nar.realtor
- National Association of Realtors. "Profile of Home Buyers and Sellers." NAR. 2026. nar.realtor
- Zillow Research. "Agent and Broker Survey." Zillow. 2026. zillow.com
- BoomTown. "Real Estate Lead Generation Benchmarks." BoomTown. 2026. boomtownroi.com
- WordStream. "Google Ads Benchmarks by Industry." WordStream. 2026. wordstream.com