From May through September 2026, our research team calculated how much it costs for an HVAC company to acquire a customer in all 50 states and Washington D.C. We built a weighted model that pairs current contractor ad-spend benchmarks with the value of consultation labor.
In the sections below, we break down HVAC customer acquisition cost by state, by region, and by marketing channel, followed by how long it takes an HVAC company to earn that cost back.
Average HVAC Customer Acquisition Cost by State: 2026
| Rank | State | Cost per Client | Vs. U.S. Avg. | Primary Cost Driver |
|---|---|---|---|---|
| 1 | Hawaii | $571 | +46% | Highest living costs in the U.S. inflate labor, travel time and overhead |
| 2 | California | $478 | +22% | Expensive labor plus crowded metro auctions in LA, the Bay Area and the Inland Empire |
| 3 | Massachusetts | $476 | +22% | High wages and dense Boston-area bidding on heat pump terms |
| 4 | District of Columbia | $470 | +20% | Small, urban market where every lead competes with Maryland and Virginia shops |
| 5 | New York | $439 | +12% | NYC metro ad prices and high technician wages |
| 6 | Alaska | $433 | +11% | Thin contractor supply offset by very high labor and travel costs |
| 7 | Maryland | $416 | +6% | DC-suburb bidding spills into Baltimore and Montgomery County |
| 8 | New Jersey | $415 | +6% | Dense suburbs with heavy aggregator and Google Ads competition |
| 9 | Washington | $413 | +6% | Seattle wages and fast-growing heat pump demand |
| 10 | Arizona | $411 | +5% | Extreme cooling season pushes AC repair bids to peak levels |
| 11 | Connecticut | $410 | +5% | High labor costs and NYC-adjacent ad competition |
| 12 | Vermont | $407 | +4% | Rural travel time and high wages raise per-client labor |
| 13 | Maine | $406 | +4% | Heat pump demand lifts competition in a small market |
| 14 | Oregon | $401 | +3% | Portland metro wages and growing heat pump adoption |
| 15 | New Hampshire | $392 | 0% | High cost base offset by moderate ad competition |
| 16 | Florida | $391 | 0% | Year-round AC demand keeps auctions crowded statewide |
| 17 | Rhode Island | $391 | 0% | Small market with Boston-area bidding pressure |
| 18 | Nevada | $386 | -1% | Las Vegas cooling demand drives intense summer bidding |
| 19 | Colorado | $380 | -3% | Front Range growth keeps both heating and cooling competitive |
| 20 | Utah | $378 | -3% | Fast-growing housing stock with moderate labor costs |
| 21 | Virginia | $375 | -4% | Northern Virginia is costly while the rest of the state runs cheaper |
| 22 | Delaware | $370 | -5% | Small market with low ad competition |
| 23 | North Carolina | $368 | -6% | Growing Charlotte and Raleigh markets with average labor costs |
| 24 | Georgia | $368 | -6% | Atlanta’s long cooling season raises bids, low labor costs offset it |
| 25 | Illinois | $367 | -6% | Chicago auctions are pricey, downstate markets pull the average down |
| 26 | Texas | $367 | -6% | Fierce AC bidding in Houston, Dallas and Austin, offset by low labor costs |
| 27 | Pennsylvania | $367 | -6% | Philadelphia and Pittsburgh competition balanced by affordable labor |
| 28 | Idaho | $365 | -7% | Boise growth with limited ad competition |
| 29 | Montana | $365 | -7% | Few contractors and low bid pressure, but long drive times |
| 30 | South Carolina | $361 | -8% | Coastal cooling demand with below-average labor costs |
| 31 | Minnesota | $361 | -8% | Heating-led demand and steady, moderate competition |
| 32 | New Mexico | $360 | -8% | Small markets and low labor costs |
| 33 | Wyoming | $360 | -8% | Sparse competition, though travel time adds labor cost |
| 34 | Wisconsin | $360 | -8% | Affordable labor and a strong referral culture |
| 35 | Ohio | $360 | -8% | Low cost base and balanced heating and cooling demand |
| 36 | South Dakota | $356 | -9% | Low competition and affordable labor |
| 37 | Louisiana | $355 | -9% | Long cooling season offset by low operating costs |
| 38 | North Dakota | $355 | -9% | Few bidders and low overhead |
| 39 | Tennessee | $350 | -10% | Nashville growth is costly, but statewide labor stays cheap |
| 40 | Michigan | $350 | -10% | Heating-heavy demand with low labor costs |
| 41 | Nebraska | $348 | -11% | Light ad competition and affordable labor |
| 42 | Kentucky | $348 | -11% | Low overhead and moderate bidding |
| 43 | West Virginia | $348 | -11% | Low-pressure ad market with low labor costs |
| 44 | Alabama | $346 | -11% | Cheap labor and modest auction pressure |
| 45 | Indiana | $344 | -12% | Low cost base and limited aggregator presence |
| 46 | Iowa | $341 | -13% | Light competition and very affordable labor |
| 47 | Arkansas | $341 | -13% | Low labor costs and few large competitors |
| 48 | Oklahoma | $340 | -13% | Lowest living costs in the U.S. keep labor cheap |
| 49 | Missouri | $340 | -13% | Affordable labor and moderate Kansas City and St. Louis bidding |
| 50 | Kansas | $339 | -13% | Low overhead and light ad competition |
| 51 | Mississippi | $336 | -14% | Low labor costs and the lightest auction pressure in the South |
Labor costs, not ad prices alone, separate the most expensive states from the cheapest. Sun Belt states like Texas, Florida and Georgia face some of the most crowded AC auctions in the country, yet still land at or below the national average because technician time costs less there. Coastal metros pay twice: once in the auction and again in wages.
Average HVAC Customer Acquisition Cost by Region: 2026
Channel choice moves CAC far more than region does. A Midwest contractor buying Google Ads ($542) pays more than three times what a West Coast contractor pays for a referral ($160). The Midwest also has the tightest state spread, only $28, which makes it the most predictable region to budget for.
Average HVAC Customer Acquisition Cost by Channel: 2026
Referrals are the cheapest way to win an HVAC client at $142, while shared-lead aggregators are the most expensive at $825. Consultation time covers calls, estimates and follow-up, valued at $55 per hour.
| Channel | Ad and Marketing Cost | Consultation Time | Total per Client | Why It Costs This Much |
|---|---|---|---|---|
| Referral | $50 | 1.67 hrs ($92) | $142 | Near-free leads that close at 60% or better; cost is mostly incentives and owner time |
| Organic Search | $140 | 2.0 hrs ($110) | $250 | SEO and Google Business Profile fees spread across high-intent, high-closing leads |
| Google Local Services Ads | $280 | 3.49 hrs ($192) | $472 | Cheap pay-per-lead pricing, but only about 1 in 5 leads becomes a paying customer |
| Meta Ads | $300 | 3.67 hrs ($202) | $502 | Low cost per lead, but cold audiences need more follow-up and close at lower rates |
| Google Ads (blended) | $433 | 2.91 hrs ($160) | $593 | Mix of branded and non-branded search |
| Lead Aggregators | $550 | 5.0 hrs ($275) | $825 | Shared leads sold to several contractors push close rates to around 10% |
| Google Ads (non-branded only) | $805 | 3.78 hrs ($208) | $1,013 | Cold searchers compare quotes, so book rates fall to about 38% |
Average HVAC CAC Payback: 2026
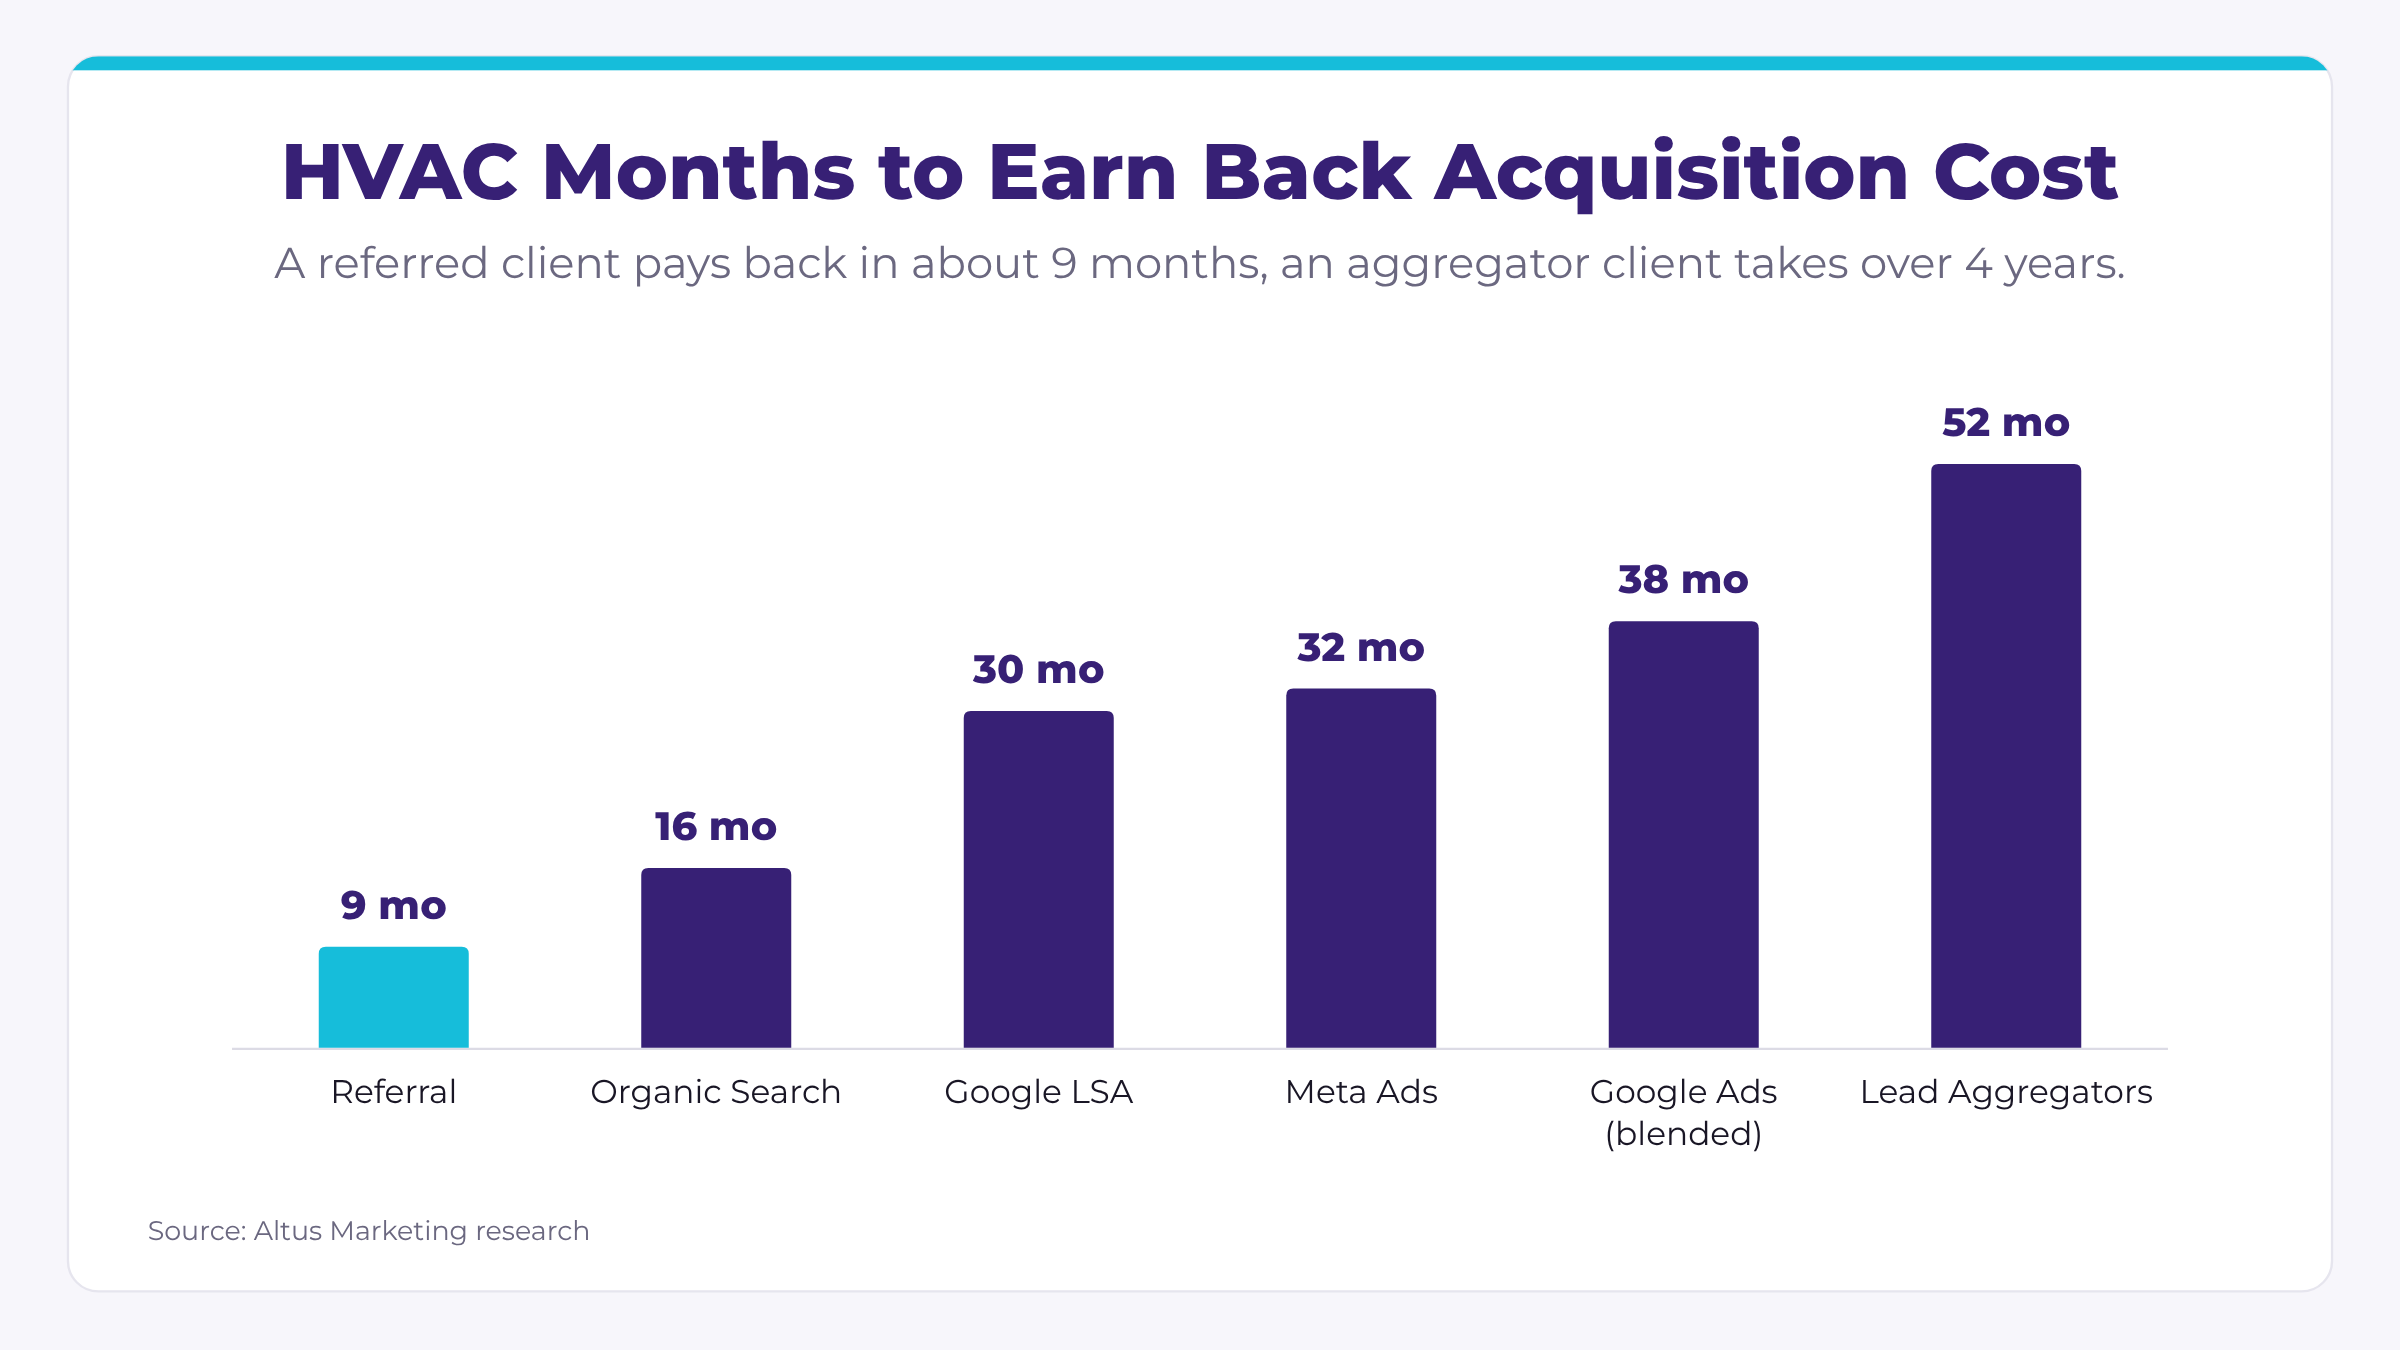
A referred client pays back their acquisition cost in about 9 months of routine service, while an aggregator client takes more than 4 years. Payback assumes a $385 average service ticket at a 35% gross margin ($135 per appointment), 1.4 visits per year and a $15,340 average customer lifetime value, adjusted for each channel’s retention.
| Channel | Revenue per $1 Spent |
|---|---|
| Referral | $125 |
| Organic Search | $64 |
| Google Local Services Ads | $31 |
| Meta Ads | $26 |
| Google Ads (blended) | $25 |
| Lead Aggregators | $14 |
Conclusion
HVAC customer acquisition cost in 2026 averages $391 all-in, but the spread between channels ($142 to $1,013) is nearly four times wider than the spread between states ($336 to $571). Three trends stand out across every table: owned channels like referrals and organic search win clients for a fraction of paid media, low cost per lead does not translate into low cost per client, and paid-heavy contractors wait years for routine service to cover what they spent. Contractors who shift budget toward referral programs, local SEO and maintenance plans that lead to replacements will lower CAC faster than any bid strategy can.
- Owned channels like referrals and organic search win clients for a fraction of paid media
- Low cost per lead does not translate into low cost per client
- Paid-heavy contractors wait years for routine service to cover what they spent
If you need help lowering your client acquisition cost, or just want a PDF copy of this report, contact Altus.
Sources
- Google Ads Benchmarks for HVAC 2026
Author: The Ad Spend
Publication: The Ad Spend
Date: July 19, 2026
URL: https://theadspend.com/blog/google-ads-search-hvac - HVAC Demand Trends: Google LSA Revenue Performance: February 2025
Author: Jon Torrey
Publication: The Data-Driven Trades
Date: March 20, 2025
URL: https://thedatadriventrades.substack.com/p/hvac-demand-trends-google-lsa-revenue-1eb - HVAC Organic Demand Trends: November 2024
Author: Jon Torrey
Publication: The Data-Driven Trades
Date: Undated (covers November 2024 data)
URL: https://thedatadriventrades.substack.com/p/hvac-organic-demand-trends-november-728 - 2026 HVAC Marketing Benchmarks: How Does Your Business Stack Up?
Author: Albert Dandy Velasquez
Publication: WebFX
Date: May 27, 2026
URL: https://www.webfx.com/blog/home-services/hvac-marketing-benchmarks/ - HVAC Facebook Ads Statistics: CPL, CTR & ROI Benchmarks (2026)
Author: Cedric Pharand
Publication: WebTonic
Date: October 9, 2026
URL: https://www.webtonic.io/blog/hvac-facebook-ads-statistics - HVAC Customer Lifetime Value: Key Insights for 2026
Author: PipelineOn Research Team
Publication: PipelineOn
Date: June 6, 2026
URL: https://pipelineon.com/blog/hvac-customer-lifetime-value/ - What Does a New HVAC Customer Actually Cost You?
Author: Zac Gawn
Publication: PipelineOn
Date: September 24, 2026
URL: https://pipelineon.com/blog/hvac-customer-acquisition-cost/ - HVAC Maintenance Agreements: Pricing, Margins, and What Customers Actually Want in 2026
Author: Joshua Thomas
Publication: Plyrium
Date: May 27, 2026
URL: https://www.plyrium.com/academy/hvac/hvac-maintenance-agreements-pricing-2026 - Cost of Living Index by State 2026
Author: World Population Review
Publication: World Population Review
Date: October 14, 2026
URL: https://worldpopulationreview.com/state-rankings/cost-of-living-index-by-state