Audiology practices operate at the intersection of healthcare and consumer retail in a way that sets them apart from most outpatient specialties. The majority of practice revenue comes from hearing aid sales rather than clinical services alone, the primary patient demographic is 65 and older, and Medicare’s coverage gap on hearing aids means most high-revenue services are sold as self-pay or supplemental insurance products. The 2022 FDA rule establishing an over-the-counter hearing aid category added a new competitive layer from retail and direct-to-consumer brands that traditional practices have had to absorb into their acquisition strategy.
Our analysis found that the average audiology practice spends about $745 to acquire a new patient in 2026, with costs ranging from $350 at ENT-integrated groups to $1,100 for retail and franchise models.
This piece breaks down audiology practice CAC by acquisition channel, patient type, insurance and coverage source, and practice setting using 2026 data from independent private practices, ENT-integrated groups, and multi-location audiology organizations.
Average Audiology Patient Acquisition Cost by State: 2026
The table below breaks down the average cost for an audiology practice to win one new patient in each of the 50 states, along with how each state compares to the $745 U.S. average.
| State | Avg. Patient CAC | Vs. U.S. Avg. |
|---|---|---|
| Alabama | $535 | -28% |
| Alaska | $1,035 | +39% |
| Arizona | $790 | +6% |
| Arkansas | $455 | -39% |
| California | $1,340 | +80% |
| Colorado | $910 | +22% |
| Connecticut | $980 | +32% |
| Delaware | $720 | -3% |
| Florida | $845 | +13% |
| Georgia | $690 | -7% |
| Hawaii | $1,545 | +107% |
| Idaho | $615 | -17% |
| Illinois | $965 | +30% |
| Indiana | $565 | -24% |
| Iowa | $515 | -31% |
| Kansas | $540 | -28% |
| Kentucky | $515 | -31% |
| Louisiana | $585 | -21% |
| Maine | $675 | -9% |
| Maryland | $1,005 | +35% |
| Massachusetts | $1,140 | +53% |
| Michigan | $625 | -16% |
| Minnesota | $730 | -2% |
| Mississippi | $440 | -41% |
| Missouri | $595 | -20% |
| Montana | $640 | -14% |
| Nebraska | $570 | -23% |
| Nevada | $850 | +14% |
| New Hampshire | $865 | +16% |
| New Jersey | $1,090 | +46% |
| New Mexico | $570 | -23% |
| New York | $1,280 | +72% |
| North Carolina | $730 | -2% |
| North Dakota | $535 | -28% |
| Ohio | $640 | -14% |
| Oklahoma | $550 | -26% |
| Oregon | $910 | +22% |
| Pennsylvania | $745 | 0% |
| Rhode Island | $825 | +11% |
| South Carolina | $660 | -11% |
| South Dakota | $515 | -31% |
| Tennessee | $685 | -8% |
| Texas | $800 | +7% |
| Utah | $760 | +2% |
| Vermont | $700 | -6% |
| Virginia | $935 | +26% |
| Washington | $1,055 | +42% |
| West Virginia | $480 | -36% |
| Wisconsin | $615 | -17% |
| Wyoming | $585 | -21% |
- Hawaii ($1,545) and California ($1,340) lead all states, where higher advertising costs and cost of living raise the price of paid search, social, and traditional media for every new patient.
- Mississippi ($440), Arkansas ($455), and West Virginia ($480) have the lowest patient CAC, reflecting lower media costs and cost of living across both digital and traditional channels.
- Mid-Atlantic and Northeast states carry a persistent premium: Virginia (+26%), Connecticut (+32%), Maryland (+35%), New Jersey (+46%), and Massachusetts (+53%) all run 26-53% above the national average, and New York sits even higher at +72%.
- 20 of 50 states sit above the $745 average, while a cluster of Southern and Plains states, including Iowa and Kentucky at $515, run about 31% below it.
CAC by Acquisition Channel
The table below breaks down average acquisition cost across the channels audiology practices use to bring in new patients, ordered from lowest to highest CAC.
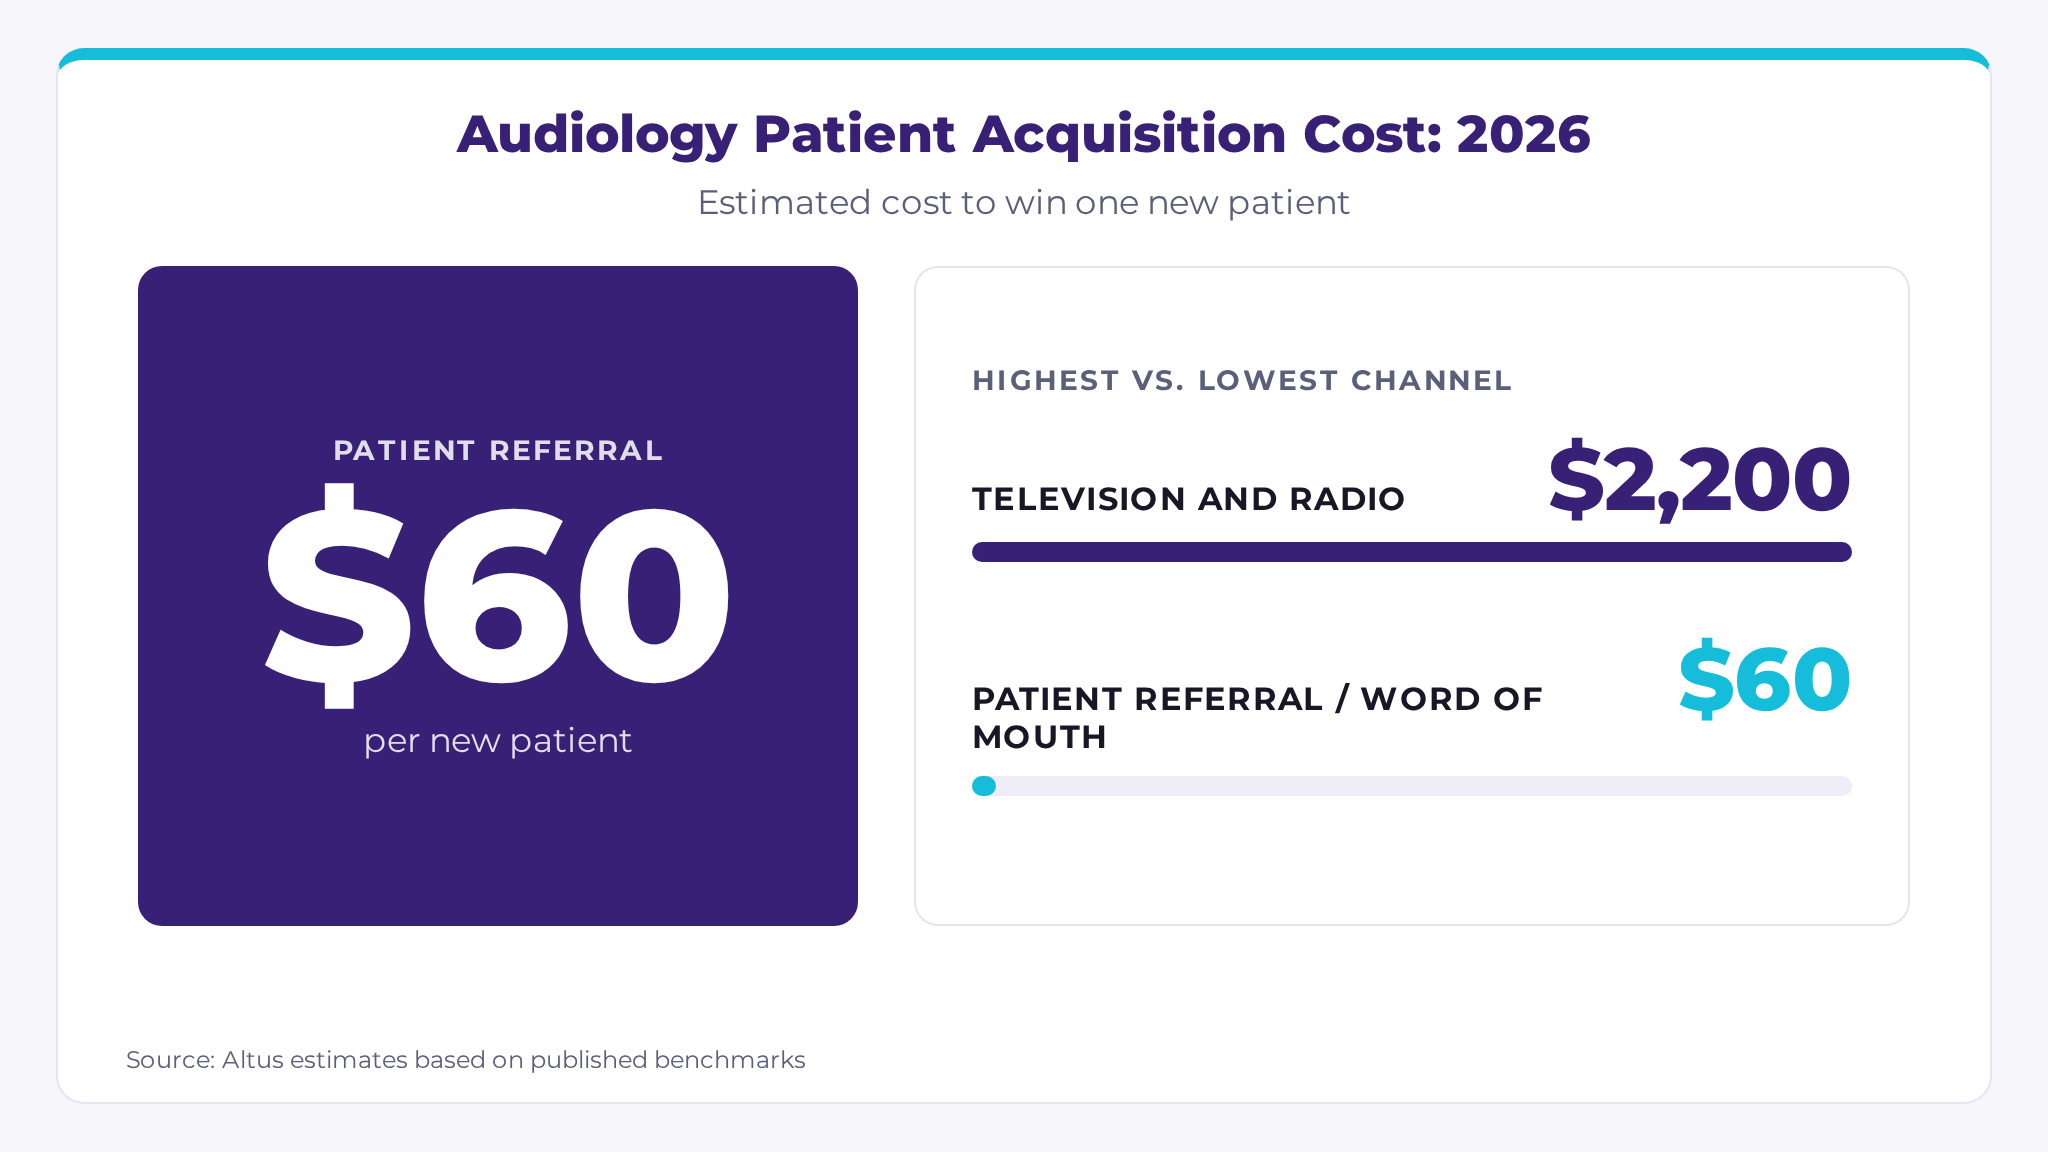
- Patient referrals are the dominant low-cost channel in this vertical because the 65+ primary demographic relies heavily on peer and family recommendations; practices with strong patient satisfaction and structured referral programs generate 25-40% of new patients through this channel
- Hearing plan network listings (TruHearing, Amplifon, HearUSA) carry a low acquisition cost but funnel patients at discounted hearing aid pricing, which can compress per-patient revenue; practices should evaluate net margin per plan-referred patient, not CAC alone
- Organic SEO and GEO occupies a distinctive position in audiology because the actual decision-maker searching online is frequently the adult child of the patient rather than the patient themselves; content that addresses family-initiated research (“how to tell if a parent needs a hearing test”) earns citations at a different point in the funnel than content targeting the patient directly
- Traditional media channels (television, radio, direct mail) remain meaningful in audiology at a higher per-patient cost than digital; the demographic skew toward patients who are 70 and older supports continued investment in channels that have largely been retired in other healthcare verticals
CAC by Patient Type
The table below breaks down average acquisition cost, initial revenue, and 10-year lifetime value by patient type and clinical need.
| Patient Type | Average CAC | Avg Initial Revenue | 10-Year LTV |
|---|---|---|---|
| Bilateral hearing aid patient | $1,100 | $5,500 | $14,800 |
| Unilateral hearing aid patient | $900 | $2,800 | $8,500 |
| Cochlear implant candidate | $1,400 | $3,500 | $18,200 |
| Pediatric and school-age | $600 | $800 | $12,000 |
| Tinnitus management | $650 | $1,200 | $4,500 |
| Balance and vestibular | $750 | $900 | $3,800 |
| New diagnostic (not yet hearing aid candidate) | $800 | $325 | $3,200 |
- Bilateral hearing aid patients represent the core revenue driver for most audiology practices; the LTV-to-CAC ratio at 13:1 is strong by any healthcare standard, and the replacement cycle creates predictable reactivation revenue that does not require re-acquiring the patient
- Cochlear implant patients carry the highest 10-year LTV on this list because post-activation audiology support (processor upgrades, mapping sessions, aural rehabilitation) creates a long-term clinical relationship with high visit frequency
- Pediatric patients carry a lower initial revenue profile but among the highest long-term LTV; a school-age patient diagnosed with hearing loss requires audiology services across decades of development, education, and adult life
- New diagnostic patients who are not yet hearing aid candidates carry the least favorable short-term return but represent the acquisition pipeline for future hearing aid revenue; practices that invest in this patient type are building a reactivation base for the following 3-5 years as candidacy develops
CAC by Insurance and Coverage Type
The table below breaks down acquisition cost and average per-patient revenue by the insurance or coverage source driving the visit.
| Coverage Type | Average CAC | Avg Revenue per Patient |
|---|---|---|
| VA and Military | $150 | $1,800 |
| Hearing Plan Network (TruHearing, Amplifon) | $200 | $3,200 |
| Medicare Advantage (with hearing benefit) | $250 | $3,800 |
| Traditional Medicare (diagnostic only) | $700 | $1,200 |
| Private Commercial Insurance | $900 | $4,500 |
| Self-Pay | $1,300 | $6,800 |
- Traditional Medicare covers diagnostic audiology but not hearing aids, which produces a coverage gap that depresses per-patient revenue for Medicare-primary practices; these patients require a separate self-pay conversation for hearing aid sales that adds friction to the purchase cycle and raises effective acquisition cost relative to revenue
- Medicare Advantage plans increasingly include hearing aid benefits, and practices that credential with these plans benefit from both a lower CAC and higher per-patient revenue than traditional Medicare, making Medicare Advantage partnerships one of the highest-ROI infrastructure investments an audiology practice can make
- Self-pay patients carry the highest acquisition cost and the highest per-patient revenue; they tend to arrive through organic search, physician referrals, and word of mouth rather than plan directories, and they purchase at full retail hearing aid pricing with no negotiated discount
- Hearing plan network patients are acquired at low cost but discounted pricing reduces revenue; practices that use these networks effectively treat them as volume channels for entry-level and mid-tier hearing aids while protecting premium device margins for direct and self-pay patients
CAC by Practice Setting
The table below breaks down average acquisition cost, monthly marketing spend, and monthly new patient volume by practice structure and setting.
| Practice Setting | Average CAC | Avg Monthly Marketing Spend | Avg Monthly New Patients |
|---|---|---|---|
| ENT-Integrated / Otolaryngology Group | $350 | $1,500-$3,500 | 8-20 |
| Hospital-Affiliated Outpatient Audiology | $500 | $2,000-$5,000 | 10-25 |
| Teleaudiology and Hybrid Practice | $700 | $2,500-$5,500 | 10-22 |
| Multi-Location Audiology Group | $820 | $8,000-$18,000 | 25-55 |
| Independent Private Practice | $950 | $3,000-$7,500 | 6-18 |
| Retail and Franchise Model | $1,100 | $4,000-$9,000 | 10-20 |
- ENT-integrated practices carry the lowest average CAC in the vertical because otolaryngology referrals represent an internal pipeline that bypasses most external marketing spend; the tradeoff is dependence on physician group dynamics that an independent practice controls directly
- Teleaudiology and hybrid practices have emerged as a mid-CAC option in the post-OTC era; remote hearing screenings and remote fine-tuning reduce access barriers for patients in rural markets while generating a digital acquisition channel that is not fully saturated the way in-person audiology search terms are in urban markets
- Independent private practices carry the second-highest CAC in this group, reflecting their reliance on external marketing spend without the internal referral infrastructure of ENT groups or the brand scale of multi-location organizations; practices that invest in physician referral network development over 12-24 months typically see the largest sustained reduction in CAC
- Retail and franchise audiology models carry the highest CAC in part because they compete most directly with Costco Hearing Centers and OTC alternatives on price and convenience; customer acquisition in this setting requires consumer advertising investment that resembles retail more than healthcare
How to Lower Audiology Patient Acquisition Cost
The steps below draw on the channel, coverage, and practice setting data in this report.
- Build a structured patient referral program. Referrals are the lowest-cost channel at $60 per patient, and practices with strong patient satisfaction generate 25-40% of new patients this way, so ask for referrals at fittings and follow-up visits.
- Credential with Medicare Advantage plans that include a hearing benefit. These patients cost $250 to acquire against $700 for traditional Medicare patients, and they bring in $3,800 in average revenue against $1,200.
- Develop an ENT and physician referral network. Physician referrals cost $230 per patient compared with $1,700 for Google Ads, and practices that build this network over 12-24 months typically see the largest sustained reduction in CAC.
- Write content for the adult children doing the research. Organic SEO and GEO costs $600 per patient, and pages that answer family questions like “how to tell if a parent needs a hearing test” reach the person who often makes the first call.
- Plan for the replacement cycle. Hearing aids are typically replaced around the 5-year mark, so recall and reactivation campaigns for existing patients bring in device revenue without paying to acquire the patient again.
If you’d like a PDF copy of this report or help lowering your audiology practice’s patient acquisition cost, contact Altus.
Sources
- American Academy of Audiology - Audiology Resources and Workforce Data
- NIDCD - Quick Statistics About Hearing
- Medicare.gov - Hearing Aid Coverage and Benefits
- FDA - Over-the-Counter Hearing Aids
- American Speech-Language-Hearing Association - Audiology Practice Resources
- Hearing Loss Association of America - Hearing Loss Facts and Statistics