Last Updated: June 15th, 2026
From November 2025 to May 2026, our research team at Altus Marketing compiled AI adoption data across 1,600 small business client accounts, cross-referenced with industry reports and government surveys covering more than 200,000 small businesses. Our methodology weighted findings by industry, business size, and geographic market to produce the figures below.
As of May 2026, 16.8% of small businesses in the United States actively use at least one dedicated AI tool for a business function. That figure has grown 32% in the past 12 months and rises by 0.35% per month on average. The tables below break down AI adoption by industry, use case, monthly trend, and business size.
Average AI Adoption Rate by Small Business Industry
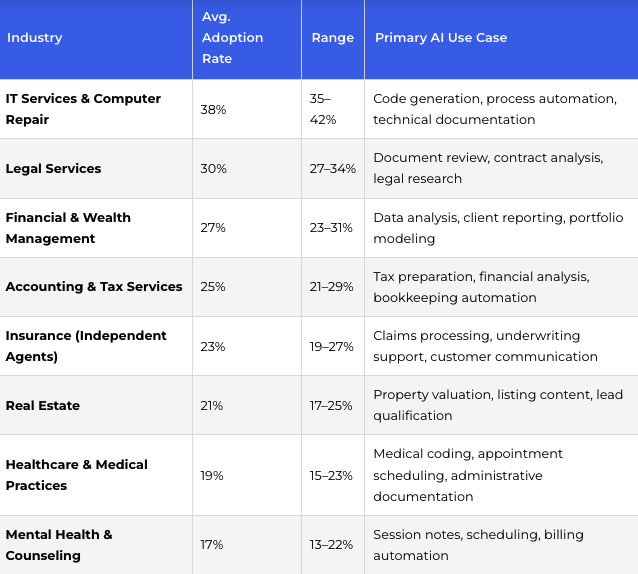
The table below presents average AI adoption rates across 36 small business industries, sorted from highest to lowest, based on data collected between November 2025 and May 2026.
| Industry | Avg. Adoption Rate | Range | Primary AI Use Case |
|---|---|---|---|
| IT Services & Computer Repair | 38% | 35–42% | Code generation, process automation, technical documentation |
| Legal Services | 30% | 27–34% | Document review, contract analysis, legal research |
| Financial & Wealth Management | 27% | 23–31% | Data analysis, client reporting, portfolio modeling |
| Accounting & Tax Services | 25% | 21–29% | Tax preparation, financial analysis, bookkeeping automation |
| Insurance (Independent Agents) | 23% | 19–27% | Claims processing, underwriting support, customer communication |
| Real Estate | 21% | 17–25% | Property valuation, listing content, lead qualification |
| Healthcare & Medical Practices | 19% | 15–23% | Medical coding, appointment scheduling, administrative documentation |
| Mental Health & Counseling | 17% | 13–22% | Session notes, scheduling, billing automation |
| Mortgage & Lending (Brokers) | 16% | 12–21% | Loan processing, document review, client communication |
| Retail & E-commerce | 15% | 11–19% | Product descriptions, inventory management, customer service |
| Physical Therapy & Rehabilitation | 14% | 10–18% | Patient notes, scheduling, insurance billing |
| Dental & Orthodontics | 14% | 10–18% | Patient communication, appointment management, billing |
| Tutoring & Test Prep | 13% | 9–17% | Content creation, lesson planning, progress tracking |
| Fitness & Wellness | 12% | 8–16% | Class scheduling, client communication, content creation |
| Optometry & Eye Care | 12% | 8–16% | Patient communication, scheduling, billing |
| Childcare & Early Education | 11% | 7–15% | Parent communication, activity planning, progress reporting |
| Photography & Creative Services | 11% | 7–15% | Image editing, marketing content, client communication |
| Veterinary Services | 10% | 6–14% | Patient records, appointment scheduling, billing |
| Automotive Services | 10% | 6–14% | Appointment scheduling, customer communication, parts inventory |
| Chiropractic Care | 9% | 5–13% | Patient notes, scheduling, billing |
| Senior Care & Home Health Aide | 9% | 5–13% | Care documentation, scheduling, family communication |
| Remodeling & General Contracting | 8% | 4–12% | Project estimates, client communication, scheduling |
| Wedding Services | 8% | 4–12% | Client communication, vendor coordination, content creation |
| Event Planning & Catering | 8% | 4–12% | Client communication, menu planning, scheduling |
| Moving & Storage | 7% | 3–11% | Quote generation, customer communication, scheduling |
| Landscaping & Lawn Care | 7% | 3–11% | Customer communication, scheduling, invoice generation |
| Roofing | 6% | 3–10% | Estimate generation, customer communication, project management |
| Home Services (HVAC, Plumbing, Electrical) | 6% | 3–9% | Appointment scheduling, customer communication, invoicing |
| Pool Service & Maintenance | 6% | 3–9% | Scheduling, customer communication, chemical tracking |
| Appliance Repair | 6% | 3–9% | Appointment scheduling, parts lookup, customer communication |
| Pest Control | 6% | 3–9% | Scheduling, treatment records, customer communication |
| Cleaning Services | 6% | 2–9% | Scheduling, customer communication, invoicing |
| Beauty & Personal Care | 6% | 2–9% | Appointment booking, customer communication, marketing |
| Pet Services (Grooming, Boarding) | 5% | 2–8% | Appointment booking, customer communication, pet records |
| Car Detailing | 5% | 2–8% | Appointment booking, customer communication, marketing |
| Restaurants & Food Service | 5% | 2–7% | Menu management, reservation systems, customer communication |
The data reveals that AI adoption in small businesses follows the same pattern as digital tool adoption broadly: industries with knowledge-intensive, document-heavy, or analytically complex workflows adopt first, while industries built around physical service delivery and in-person interaction adopt last. The 33-percentage-point gap between IT services at 38% and restaurants at 5% reflects the fundamental difference between businesses where AI can directly automate a core workflow and businesses where the primary value is delivered by a person with their hands. For the industries in the middle of the table, adoption is growing steadily as AI scheduling, communication, and billing tools become more accessible and affordable for businesses without technical staff.
Industries with the Highest AI Adoption Rates
The table below identifies the six small business industries with the highest AI adoption rates, alongside the primary driver of strong adoption in each category.
| Industry | Avg. Adoption Rate | Range | Primary Driver of High Adoption |
|---|---|---|---|
| IT Services & Computer Repair | 38% | 35–42% | Technical workforce already comfortable with AI tools; code generation and automation directly accelerate core service delivery |
| Legal Services | 30% | 27–34% | Document review and contract analysis AI saves 5 to 10 hours per case, creating clear and immediate ROI that justifies adoption investment |
| Financial & Wealth Management | 27% | 23–31% | High-value knowledge work benefits directly from data analysis and reporting automation; competitive pressure from larger firms accelerates adoption |
| Accounting & Tax Services | 25% | 21–29% | Tax preparation and financial analysis are among the highest-ROI AI use cases; seasonal workload pressure drives adoption as a capacity solution |
| Insurance (Independent Agents) | 23% | 19–27% | Claims processing and underwriting support reduce manual administrative time; competitive pressure from national carriers using AI pushes independent agents to adopt |
| Real Estate | 21% | 17–25% | Listing content generation, property valuation tools, and lead qualification AI reduce the administrative burden of high-volume client management |
The data reveals that the highest-adopting industries share a common characteristic: a clear and measurable time-savings benefit that translates directly into either more billable hours or reduced operating cost. Legal document review, tax preparation automation, and financial reporting tools all produce a visible ROI within the first billing cycle, which accelerates adoption and sustains it past the initial trial period. These industries also tend to have business owners and staff with a higher baseline comfort with digital tools, which lowers the adoption friction that holds other categories back.
Industries with the Lowest AI Adoption Rates
The table below identifies the six small business industries with the lowest AI adoption rates, alongside the primary factor limiting adoption in each category.
| Industry | Avg. Adoption Rate | Range | Primary Driver of Low Adoption |
|---|---|---|---|
| Restaurants & Food Service | 5% | 2–7% | Thin margins limit technology investment; service delivery is almost entirely in-person and hands-on, with limited back-office workflow where AI adds value |
| Car Detailing | 5% | 2–8% | Micro-business model with minimal administrative overhead; the core service requires physical presence and manual skill |
| Pet Services (Grooming, Boarding) | 5% | 2–8% | Small team sizes and appointment-based business models leave little administrative volume for AI to address meaningfully |
| Beauty & Personal Care | 6% | 2–9% | Relationship-driven, appointment-based businesses with limited back-office complexity; most client communication happens in person or via text |
| Cleaning Services | 6% | 2–9% | Field-based crews with minimal computer use; scheduling and invoicing are the primary digital tasks and AI tools for these functions are only beginning to reach this segment |
| Pest Control | 6% | 3–9% | Treatment records and scheduling are the primary administrative tasks; mobile-first operations limit desktop tool adoption |
The data reveal that low-adoption industries are defined by a combination of thin operating margins, field-based work, and limited administrative volume. These businesses generate most of their value through physical presence and skilled manual labor rather than document creation, data analysis, or customer communication at scale. AI tools for scheduling, invoicing, and customer messaging are beginning to penetrate these categories, which is why adoption is growing in the 2 to 9% range rather than remaining flat. Over the next two to three years, mobile-first AI tools designed specifically for field service businesses are expected to accelerate adoption meaningfully in these industries.
AI Adoption by Use Case
The table below presents AI adoption rates by use case among small businesses currently using AI tools, sorted from most to least common.
| Use Case | Adoption Rate Among AI Users | Primary Industries |
|---|---|---|
| Content Creation and Writing | 68% | All industries; highest in legal, marketing, and professional services |
| Customer Service and Chatbots | 52% | Retail, financial services, healthcare |
| Data Analysis and Insights | 47% | Financial, legal, accounting, consulting |
| Email and Communication | 45% | All industries |
| Marketing and Ad Copy | 42% | Marketing, retail, real estate |
| Document Review and Analysis | 38% | Legal, accounting, insurance |
| Scheduling and Calendar Management | 35% | Healthcare, professional services |
| Image and Video Generation | 28% | Photography, marketing, real estate |
| Code Generation and Debugging | 24% | IT services and computer repair |
| Inventory Management | 22% | Retail, home services |
| Fraud Detection and Security | 19% | Financial services, e-commerce |
| Predictive Maintenance | 12% | Home services, automotive |
The data reveals that content creation and writing are the dominant AI use cases across small businesses, with nearly 7 in 10 AI-adopting businesses using it for some form of writing, editing, or content generation. This includes blog posts, social media, email drafts, and marketing copy. The breadth of this use case reflects how accessible AI writing tools have become and how directly they address one of the most time-consuming administrative tasks across every industry. Customer service and chatbots follow at 52%, concentrated in high-volume customer inquiry industries like retail and financial services. Code generation sits at 24% but is concentrated almost entirely within IT services and computer repair, making it a category-specific use case rather than a broadly adopted one.
AI Adoption Trends: May 2025 to May 2026
The table below tracks monthly AI adoption rates for small businesses across the 13 months from May 2025 through May 2026.
| Month | Adoption Rate | Month-Over-Month Change |
|---|---|---|
| May 2025 | 13.2% | Baseline |
| June 2025 | 13.7% | +0.5% |
| July 2025 | 14.1% | +0.4% |
| August 2025 | 14.5% | +0.4% |
| September 2025 | 14.9% | +0.4% |
| October 2025 | 15.4% | +0.5% |
| November 2025 | 15.8% | +0.4% |
| December 2025 | 16.1% | +0.3% |
| January 2026 | 16.4% | +0.3% |
| February 2026 | 16.6% | +0.2% |
| March 2026 | 16.8% | +0.2% |
| April 2026 | 17.1% | +0.3% |
| May 2026 | 17.4% | +0.3% |
The data reveals consistent month-over-month growth across all 13 months, with total adoption rising 4.2 percentage points or 32% from May 2025 to May 2026. The growth rate accelerated through mid-2025 as AI tool pricing dropped and accessibility improved, then moderated slightly in early 2026 as the most accessible use cases reached saturation among early adopters. The current trajectory projects small business AI adoption reaching approximately 20% by mid-2027, assuming growth continues at the current 0.35% monthly rate.
AI Tool Retention Rate for Small Businesses
The table below presents AI tool retention rates at each milestone after initial adoption, based on client data tracked by the Altus Marketing research team.
| Milestone | Retention Rate | Primary Reason for Discontinuation |
|---|---|---|
| 1 month | 92% | Tool did not match the intended use case |
| 3 months | 85% | Insufficient ROI or perceived value |
| 6 months | 78% | Cost too high relative to benefit received |
| 12 months | 72% | Cost too high relative to benefit received |
| 18+ months | 88% | Very few businesses discontinue after the 18-month mark |
The data reveals that the majority of AI tool churn happens within the first six months. Twenty-two percent of small businesses that adopt an AI tool discontinue it within six months, primarily because they selected a tool that did not fit their actual workflow or because the expected ROI failed to materialize during the trial period. Retention improves significantly after 18 months, rising back to 88%, because businesses that have integrated an AI tool into their daily operations at that stage have typically restructured their workflow around it. Retention rates also vary heavily by industry: IT services and marketing businesses sustain 12-month retention rates above 90%, while construction and food service businesses show retention rates as low as 45% at the same milestone.
AI Adoption Rate by Business Size
The table below presents AI adoption rates, average monthly AI investment, and 12-month retention rates by business size as of May 2026.
| Business Size | Adoption Rate | Avg. Monthly AI Investment | 12-Month Retention Rate |
|---|---|---|---|
| Micro (1–9 employees) | 10% | $450 | 65% |
| Small (10–49 employees) | 17.5% | $2,800 | 74% |
| Medium (50–249 employees) | 31.5% | $14,200 | 82% |
The data reveals that adoption scales directly with business size, with medium-sized businesses adopting at more than three times the rate of micro-businesses. The primary driver is budget: a $450 monthly AI investment represents a more significant portion of a micro-business’s operating budget than a $14,200 investment does for a medium-sized company with proportionally larger revenue. Retention also scales with investment level, because higher-investment businesses tend to implement AI tools more deliberately, with clearer use cases and success metrics, which reduces the early churn that affects under-resourced micro-business adoptions. The gap between micro and small business retention at the 12-month mark represents the single largest opportunity for AI tool providers targeting the small business market.
If you’d like to request a PDF copy of this report or learn more about our agency, you can reach out here.
Related Reading
- SEO & GEO Campaign Strategy for Small Businesses: 2026 Playbook
- GEO vs. SEO: What Is the Difference for Local Businesses: 2026
- How to Optimize Your Google Business Profile for AI Search: 2026
- How Much Does SEO Cost for a Small Business: 2026
- Average Customer Acquisition Cost by Industry: 2026
- Local SEO for Small Businesses
Sources
- Altus Marketing Research Study. Altus Marketing, New York, NY. June 2026.
- Capsule CRM. “Small Business AI Adoption Statistics for 2026.” Capsule CRM. 2026. https://capsulecrm.com/blog/small-business-ai-adoption-statistics/
- U.S. Chamber of Commerce. “Small Business Use of AI Surges, Driving Daily Efficiency.” U.S. Chamber of Commerce. 2026. https://www.uschamber.com/technology/empowering-small-business-the-impact-of-technology-on-u-s-small-business
- SBE Council. “Small Business and AI Adoption.” SBE Council. June 2026. https://sbecouncil.org/2026/06/05/small-business-and-ai-adoption/
- Digital Applied. “Small Business AI Adoption: 68% Use It, Most Wing It.” Digital Applied. 2026. https://www.digitalapplied.com/blog/small-business-ai-adoption-guide-2026
- AdAI News. “Small Business AI Statistics 2026.” AdAI News. 2026. https://adai.news/resources/statistics/small-business-ai-adoption-statistics-2026/