From May to September 2026, our research team studied how much it costs a personal trainer to win one new paying client in all 50 states and Washington, D.C. We compiled data from 14 sources, including national advertising cost data, federal wage and regional price data, trainer surveys, and fitness sales funnel data, then combined them in a weighted model that reflects where trainers say their clients come from.
In the sections below, we break down personal trainer client acquisition cost by state, by region, and by marketing channel, along with how long it takes a trainer to earn that cost back.
Average Personal Trainer Client Acquisition Cost by State: 2026
The table ranks all 50 states and Washington, D.C. from most to least expensive, with the cost of each channel.
| Rank | State | Avg. Cost per New Client | % vs U.S. Average ($329) |
|---|---|---|---|
| 1 | California | $364 | +10.7% |
| 2 | Hawaii | $361 | +10.0% |
| 3 | District of Columbia | $361 | +9.9% |
| 4 | New Jersey | $357 | +8.8% |
| 5 | New York | $355 | +7.9% |
| 6 | Washington | $352 | +7.0% |
| 7 | Massachusetts | $347 | +5.8% |
| 8 | Maryland | $345 | +5.0% |
| 9 | New Hampshire | $342 | +4.2% |
| 10 | Connecticut | $340 | +3.6% |
| 11 | Florida | $340 | +3.4% |
| 12 | Oregon | $340 | +3.4% |
| 13 | Colorado | $339 | +3.1% |
| 14 | Alaska | $336 | +2.4% |
| 15 | Rhode Island | $336 | +2.3% |
| 16 | Virginia | $332 | +1.1% |
| 17 | Arizona | $331 | +0.7% |
| 18 | Nevada | $328 | 0.0% |
| 19 | Illinois | $328 | 0.0% |
| 20 | Delaware | $328 | -0.2% |
| 21 | Utah | $325 | -1.1% |
| 22 | Minnesota | $324 | -1.4% |
| 23 | Vermont | $322 | -2.0% |
| 24 | Pennsylvania | $321 | -2.4% |
| 25 | Texas | $319 | -2.9% |
| 26 | Maine | $319 | -3.0% |
| 27 | Georgia | $316 | -3.7% |
| 28 | Michigan | $316 | -3.8% |
| 29 | Idaho | $314 | -4.5% |
| 30 | Montana | $311 | -5.4% |
| 31 | North Carolina | $310 | -5.7% |
| 32 | Wisconsin | $309 | -5.9% |
| 33 | South Carolina | $308 | -6.3% |
| 34 | Indiana | $307 | -6.7% |
| 35 | Ohio | $305 | -7.2% |
| 36 | Wyoming | $305 | -7.3% |
| 37 | New Mexico | $303 | -7.8% |
| 38 | Tennessee | $302 | -8.1% |
| 39 | Missouri | $298 | -9.2% |
| 40 | Kentucky | $296 | -9.8% |
| 41 | Nebraska | $296 | -9.9% |
| 42 | Kansas | $296 | -9.9% |
| 43 | West Virginia | $294 | -10.5% |
| 44 | North Dakota | $292 | -11.0% |
| 45 | Alabama | $292 | -11.2% |
| 46 | South Dakota | $291 | -11.4% |
| 47 | Louisiana | $290 | -11.8% |
| 48 | Oklahoma | $289 | -12.2% |
| 49 | Iowa | $288 | -12.2% |
| 50 | Mississippi | $286 | -13.0% |
| 51 | Arkansas | $286 | -13.1% |
The data reveals that a trainer in California pays about $78 more per client than a trainer in Arkansas, a 27% gap that tracks each state’s overall cost of living. Even so, how a trainer finds clients matters far more than where they work, since a Google Ads client costs more than nine times as much as a referral in every state. Because what clients pay for local services generally follows the same cost-of-living pattern, trainers in higher-cost states can usually charge more per session to make up the difference.
Average Personal Trainer Client Acquisition Cost by Region: 2026
The table below breaks down the average cost for a personal trainer to acquire one new client in each U.S. region. Regions follow U.S. Census groupings, with D.C. counted in the South
| Region | Referral | Organic Search | Meta Ads | Google Ads | Blended CAC | Lowest to Highest State |
|---|---|---|---|---|---|---|
| Northeast | $108 | $527 | $436 | $1,007 | $338 | $319 to $357 |
| West | $106 | $517 | $428 | $988 | $331 | $303 to $364 |
| South | $100 | $486 | $402 | $928 | $311 | $286 to $361 |
| Midwest | $98 | $475 | $393 | $907 | $304 | $288 to $328 |
The data reveals that the South has the widest spread of any region, from $286 in Arkansas and Mississippi to $361 in D.C., so a regional average says little about any one local market there. The Midwest is the most affordable region, and no Midwest state tops the national average of $329. In the Northeast, even the lowest-cost state, Maine at $319, sits within about 3% of the national figure.
Average Personal Trainer Client Acquisition Cost by Channel: 2026
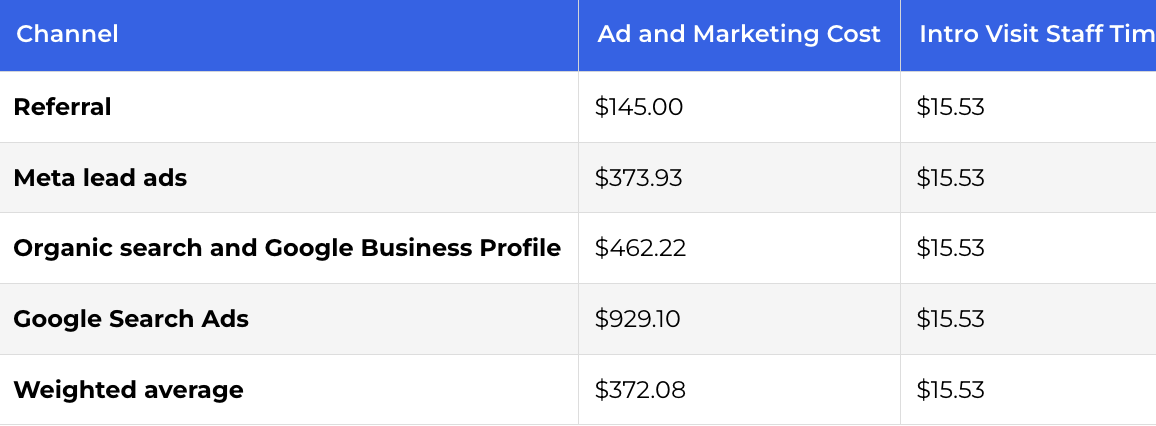
The table below breaks down the average cost for a personal trainer to acquire one new client through each marketing channel, along with the weighted average across all channels.
| Channel | Ad and Marketing Cost | Consultation Time | Total Cost per Client |
|---|---|---|---|
| Referral | $55.00 | $50.38 | $105.38 |
| Meta lead ads | $373.93 | $50.38 | $424.31 |
| Organic search and Google Business Profile | $462.22 | $50.38 | $512.60 |
| Google Search Ads | $929.10 | $50.38 | $979.48 |
| Weighted average | $278.17 | $50.38 | $328.55 |
The data shows that ad and marketing spend, not the trainer’s time, creates almost the entire gap between channels, since consultation time adds the same $50.38 to every row. Because about half of new clients come through referrals, the average sits much closer to the referral cost than to any paid channel. A trainer who replaces referred clients with Google Ads clients pays roughly nine times more for each one.
Average Personal Trainer CAC Payback: 2026
The table below breaks down how many training sessions it takes a personal trainer to earn back the cost of acquiring a new client through each channel, based on a typical $55 hourly rate
| Channel | Cost per Client | Sessions to Earn It Back | Months to Earn It Back | Lifetime Revenue per $1 Spent |
|---|---|---|---|---|
| Referral | $105 | 1.9 | 0.2 | $11.86 |
| Meta lead ads | $424 | 7.7 | 1.0 | $2.95 |
| Organic search and Google Business Profile | $513 | 9.3 | 1.2 | $2.44 |
| Google Search Ads | $979 | 17.8 | 2.3 | $1.28 |
| Weighted average | $329 | 6.0 | 0.8 | $3.80 |
The data indicates that every channel pays for itself quickly, but not every channel pays off over the life of a client: with a typical client worth about $425 a month and $1,250 in total, only referrals and the overall average clear the common rule of thumb of $3 in lifetime revenue for every $1 spent to win a client. Google Ads, at $1.28 per $1, works best for trainers whose clients stay longer or buy bigger packages than average. Typical clients stay anywhere from three months to a year, so keeping clients longer is what makes paid ads worth it.
If you’d like a PDF copy of this report or help lowering your client acquisition cost, contact Altus.
Related Reading
- Average Customer Acquisition Cost (CAC) by Industry: 2026 Small Business Report
- Average Cost Per Lead by Small Business Industry: 2026 Analysis
- Gym Membership Cost Per Month: State-by-State Analysis 2026
- SEO and GEO for Fitness Businesses
Sources
- Google Ads Benchmarks 2026: Competitive Data & Insights for Every Industry
Author: Susie Marino
Publication: WordStream by LocaliQ
Date: May 19, 2026
URL: https://www.wordstream.com/blog/2026-google-ads-benchmarks - Facebook Ads Benchmarks 2026: NEW Data, Trends, & Insights for Your Industry
Author: Susie Marino
Publication: WordStream by LocaliQ
Date: September 14, 2026
URL: https://www.wordstream.com/blog/facebook-ads-benchmarks-2026 - Average Customer Acquisition Cost (CAC) by Industry: 2026 Small Business Report
Author: Maddie Lynch
Publication: Altus Marketing
Date: June 15, 2026
URL: https://altusmarketing.co/blog/customer-acquisition-cost-for-small-businesses/ - Average Cost Per Lead Small Business Industry: 2026 Analysis
Author: Maddie Lynch
Publication: Altus Marketing
Date: August 24, 2026
URL: https://altusmarketing.co/blog/average-cost-per-lead-by-industry/ - Average Customer Acquisition Cost for Gyms
Author: Chase McGee
Publication: Focus Digital
Date: May 27, 2024
URL: https://focus-digital.co/average-customer-acquisition-cost-for-gyms/ - Why Only 3 to 6 Out of Every 100 Paid Fitness Leads Become Members
Author: Mantas Dvareckas
Publication: Keepme
Date: September 10, 2026
URL: https://www.keepme.ai/blog/why-only-3-to-6-out-every-100-paid-fitness-leads-become-members - The Leaky Funnel: Why Your Gym’s Ads Don’t Convert (and How to Fix Each Stage)
Author: Liz Childers
Publication: PushPress
Date: May 11, 2026
URL: https://www.pushpress.com/blog/leaky-funnel-gym-ads - Key Performance Indicators (KPIs) for Personal Trainers
Author: Dan Salcumbe
Publication: Institute of Personal Trainers
Date: Updated September 25, 2026
URL: https://instituteofpersonaltrainers.com/encyclopedia-key-performance-indicators-kpis-for-personal-trainers - The Personal Trainer KPI Cheat Sheet
Author: ABC Trainerize
Publication: ABC Trainerize
Date: July 2025
URL: https://resources.trainerize.com/hubfs/The%20Personal%20Trainer%20KPI%20Cheat%20Sheet%20-%20ABC%20Trainerize.pdf - 2025 State of the Personal Trainer: An Industry Report
Author: ABC Trainerize
Publication: ABC Trainerize
Date: January 2025
URL: https://resources.trainerize.com/hubfs/State%20of%20the%20Personal%20Training%20Industry%20Report%202025.pdf - Survey Results: The Best In Personal Training & Fitness Industry Trends for 2026
Author: Eddie Lester
Publication: Fitness Mentors
Date: Updated August 31, 2026
URL: https://www.fitnessmentors.com/best-in-fitness-industry-personal-training-2025/ - How much does it cost to hire personal trainers?
Author: Thumbtack Staff
Publication: Thumbtack
Date: October 20, 2025
URL: https://www.thumbtack.com/p/personal-trainer-cost - Fitness Trainers and Instructors, Occupational Outlook Handbook
Author: U.S. Bureau of Labor Statistics
Publication: U.S. Bureau of Labor Statistics
Date: August 27, 2026
URL: https://www.bls.gov/ooh/personal-care-and-service/fitness-trainers-and-instructors.htm - Regional Price Parities by State and Metro Area
Author: U.S. Bureau of Economic Analysis
Publication: U.S. Bureau of Economic Analysis
Date: February 19, 2026
URL: https://www.bea.gov/data/prices-inflation/regional-price-parities-state-and-metro-area