Last Updated: June 15th, 2026
From November 2025 through May 2026, our research team compiled AI search data from 1,600 small business client accounts and cross-referenced findings with eight published industry reports covering more than 200,000 businesses. Because each data source used a different methodology for measuring AI search activity, we applied a weighted average across all sources with weights based on sample size, recency, and methodology rigor. The sections below break down how AI search is affecting small business visibility across industry, consumer behavior, Google AI Overview penetration, business readiness, and organic traffic impact.
AI-Assisted Discovery Rate by Small Business Industry: 2026
The table below presents AI-assisted customer discovery rates and year-over-year AI search query growth across 36 small business industries, sorted from highest to lowest discovery impact. AI-assisted discovery rate refers to the share of new customer inquiries that originated from an AI tool rather than a traditional search engine result.
| Industry | AI-Assisted Discovery Rate | AI Search Query Growth (YoY) | Primary AI Query Type |
|---|---|---|---|
| Restaurants & Food Service | 42% | +68% | “Best [cuisine] near me,” “where should I eat tonight in [city]” |
| Legal Services | 38% | +72% | “Best [practice area] attorney in [city],” “who handles [case type] near me” |
| Healthcare & Medical Practices | 36% | +65% | “Best primary care doctor near me,” “urgent care in [city]” |
| Dental & Orthodontics | 34% | +61% | “Dentist accepting new patients in [city],” “best orthodontist near me” |
| Home Services (HVAC, Plumbing, Electrical) | 33% | +58% | “Emergency plumber near me,” “HVAC repair in [city]” |
| Appliance Repair | 32% | +62% | “Appliance repair near me,” “washer repair same day in [city]” |
| Financial & Wealth Management | 31% | +74% | “Best financial advisor for small business,” “fiduciary planner near me” |
| Pest Control | 30% | +55% | “Pest control near me,” “emergency exterminator in [city]” |
| Mental Health & Counseling | 29% | +78% | “Therapist accepting new patients near me,” “affordable counseling in [city]” |
| Real Estate | 28% | +52% | “Best real estate agent in [city],” “top realtors near me” |
| Chiropractic Care | 27% | +48% | “Chiropractor near me,” “best chiropractor for back pain in [city]” |
| Fitness & Wellness | 26% | +45% | “Best gym near me,” “personal trainer in [city]” |
| Roofing | 25% | +58% | “Roof repair near me,” “emergency roofing contractor in [city]” |
| Veterinary Services | 24% | +42% | “Vet near me accepting new patients,” “emergency vet in [city]” |
| Insurance (Independent Agents) | 23% | +44% | “Best home insurance agent near me,” “independent insurance broker in [city]” |
| Physical Therapy & Rehabilitation | 22% | +44% | “Physical therapist near me,” “PT accepting new patients in [city]” |
| Accounting & Tax Services | 22% | +38% | “CPA near me,” “best tax accountant for small business in [city]” |
| IT Services & Computer Repair | 21% | +48% | “Computer repair near me,” “IT support for small business in [city]” |
| Optometry & Eye Care | 20% | +36% | “Eye doctor near me,” “optometrist accepting new patients in [city]” |
| Retail & E-commerce | 19% | +42% | “Best [product type] store near me,” “where to buy [item] in [city]” |
| Cleaning Services | 19% | +34% | “House cleaning service near me,” “best cleaning company in [city]” |
| Automotive Services | 18% | +32% | “Auto repair near me,” “best mechanic in [city]” |
| Moving & Storage | 17% | +38% | “Moving companies near me,” “best movers in [city]” |
| Tutoring & Test Prep | 16% | +42% | “Math tutor near me,” “SAT prep in [city]” |
| Senior Care & Home Health Aide | 15% | +48% | “Home health aide near me,” “senior care services in [city]” |
| Landscaping & Lawn Care | 14% | +28% | “Lawn care near me,” “landscaping company in [city]” |
| Childcare & Early Education | 13% | +32% | “Daycare near me,” “best preschool in [city]” |
| Mortgage & Lending (Brokers) | 12% | +35% | “Mortgage broker near me,” “best home loan rates in [city]” |
| Remodeling & General Contracting | 11% | +28% | “Remodeling contractor near me,” “kitchen remodel in [city]” |
| Beauty & Personal Care | 10% | +24% | “Hair salon near me,” “best nail salon in [city]” |
| Pool Service & Maintenance | 9% | +22% | “Pool cleaning service near me,” “pool repair in [city]” |
| Pet Services (Grooming, Boarding) | 8% | +20% | “Dog grooming near me,” “pet boarding in [city]” |
| Event Planning & Catering | 8% | +25% | “Event planner near me,” “catering company in [city]” |
| Car Detailing | 7% | +18% | “Car detailing near me,” “mobile car detailing in [city]” |
| Wedding Services | 7% | +22% | “Wedding photographer near me,” “wedding venue in [city]” |
| Photography & Creative Services | 6% | +18% | “Photographer near me,” “headshot photographer in [city]” |
The data reveals that AI-assisted discovery rates are highest in industries where customers face urgency or high-trust decisions, exactly the conditions where an AI recommendation from a perceived authoritative source carries the most weight. Mental health and counseling (+78%), financial services (+74%), and legal (+72%) lead year-over-year query growth, reflecting a shift toward using AI tools for sensitive service decisions where a conversational recommendation feels more reliable than a ranked list of websites. Every industry in the table shows positive year-over-year query growth, confirming that no small business category is unaffected by the shift.
Consumer AI Adoption for Local Business Discovery: 2026
As of 2026, 35% of consumers use an AI tool to find a local business or service before making contact, up from 8% just three years ago. The chart and table below track the adoption rate from 2023 through 2026.
| Year | Consumers Using AI to Find Local Businesses | Year-Over-Year Change |
|---|---|---|
| 2023 | 8% | Baseline |
| 2024 | 18% | +125% |
| 2025 | 27% | +50% |
| 2026 | 35%+ | +30% |
The data reveals that consumer adoption of AI for local business discovery has grown fourfold in three years, with the steepest single-year jump occurring between 2023 and 2024 when adoption more than doubled. The 25 to 34 age group shows the highest adoption rate of any demographic, which means the customer segment most likely to be discovering a local business for the first time is the segment most actively using AI tools to make that decision.
AI Overview Appearance Rate by Search Intent: 2026
Google AI Overviews now appear in 55% of all searches, but that rate varies significantly by search type, with informational queries triggering Overviews in 88% of cases and local intent queries triggering them in just 7%.

| Search Intent Type | AI Overview Appearance Rate | Zero-Click Rate |
|---|---|---|
| All searches | 55% | 58% |
| Informational intent | 88% | 83% |
| Transactional intent | 28% | 35% |
| Local intent | 7% | 42% |
The data reveals that local intent searches trigger Google AI Overviews at a dramatically lower rate than informational queries, 7% versus 88%. This does not mean AI search is less relevant for local businesses. It means the AI search activity most affecting local business discovery is happening on ChatGPT, Perplexity, and Bing Copilot rather than through Google AI Overviews specifically, where those platforms step in to handle the recommendation queries that Google’s AI Overview largely skips.
AI Search Readiness Among Small Businesses: 2026
Despite the scale of the shift, the overwhelming majority of small businesses have taken no steps to optimize for or measure AI search visibility. The table below breaks down readiness by business size.
[INSERT CHART: AI Search Readiness Bar Chart]
| Business Size | Active AI Search Strategy | Tracking AI Visibility | GBP Optimized |
|---|---|---|---|
| Micro (1 to 9 employees) | 8% | 10% | 42% |
| Small (10 to 49 employees) | 14% | 16% | 58% |
| Medium (50 to 249 employees) | 22% | 24% | 71% |
| Business Size | Active AI Search Strategy | Tracking AI Visibility | GBP Optimized |
|---|---|---|---|
| Micro (1 to 9 employees) | 8% | 10% | 42% |
| Small (10 to 49 employees) | 14% | 16% | 58% |
| Medium (50 to 249 employees) | 22% | 24% | 71% |
The data reveals that even among medium-sized businesses, 78% have taken no steps to optimize for AI search visibility. At the micro-business level, 92% have no active AI search strategy. The gap between readiness and consumer adoption, where 35% of consumers are using AI to find businesses while fewer than 1 in 10 small businesses have any AI visibility strategy, represents the single largest competitive advantage available in local search today. Businesses that establish AI citation authority while competitors remain inactive are building a lead that will become increasingly difficult to close as the channel matures.
The Impact of AI Overviews on Organic Traffic: 2026
US organic search traffic is declining year-over-year for the first time in over a decade. The tables below show the click-through rate impact of AI Overviews by ranking position and the year-over-year organic traffic trend from 2023 through 2026.
The Organic CTR Impact of AI Overviews by Ranking Position — 2026
[INSERT CHART: Organic CTR Impact Bar Chart]
| Ranking Position | CTR Without AI Overview | CTR With AI Overview | Decline |
|---|---|---|---|
| Position 1 | 28.5% | 19.6% | -31% |
| Positions 2 to 5 | 15.7% | 11.2% | -29% |
| Positions 6 to 10 | 8.4% | 6.1% | -27% |
The US Organic Search Traffic Change: 2023–2026
[INSERT CHART: Organic Traffic Trend Line Chart]
| Year | US Organic Search Traffic Change (YoY) |
|---|---|
| 2023 | +4.2% |
| 2024 | +1.8% |
| 2025 | -0.8% |
| 2026 | -2.5% |
The data reveals that AI Overviews reduce organic click-through rates by 27 to 31% across all ranking positions, with the steepest impact at position 1. Organic traffic crossed from positive to negative growth between 2024 and 2025 and has continued declining, reflecting the structural shift as AI search absorbs a growing share of discovery queries. Notably, 40% of sources cited in AI Overviews rank in positions 11 to 20, meaning businesses outside the top 10 can still gain AI-generated visibility when their content structure and authority signals are strong.
If you’d like to request a PDF copy of this report or learn more about our agency, you can reach out here.
Related Reading
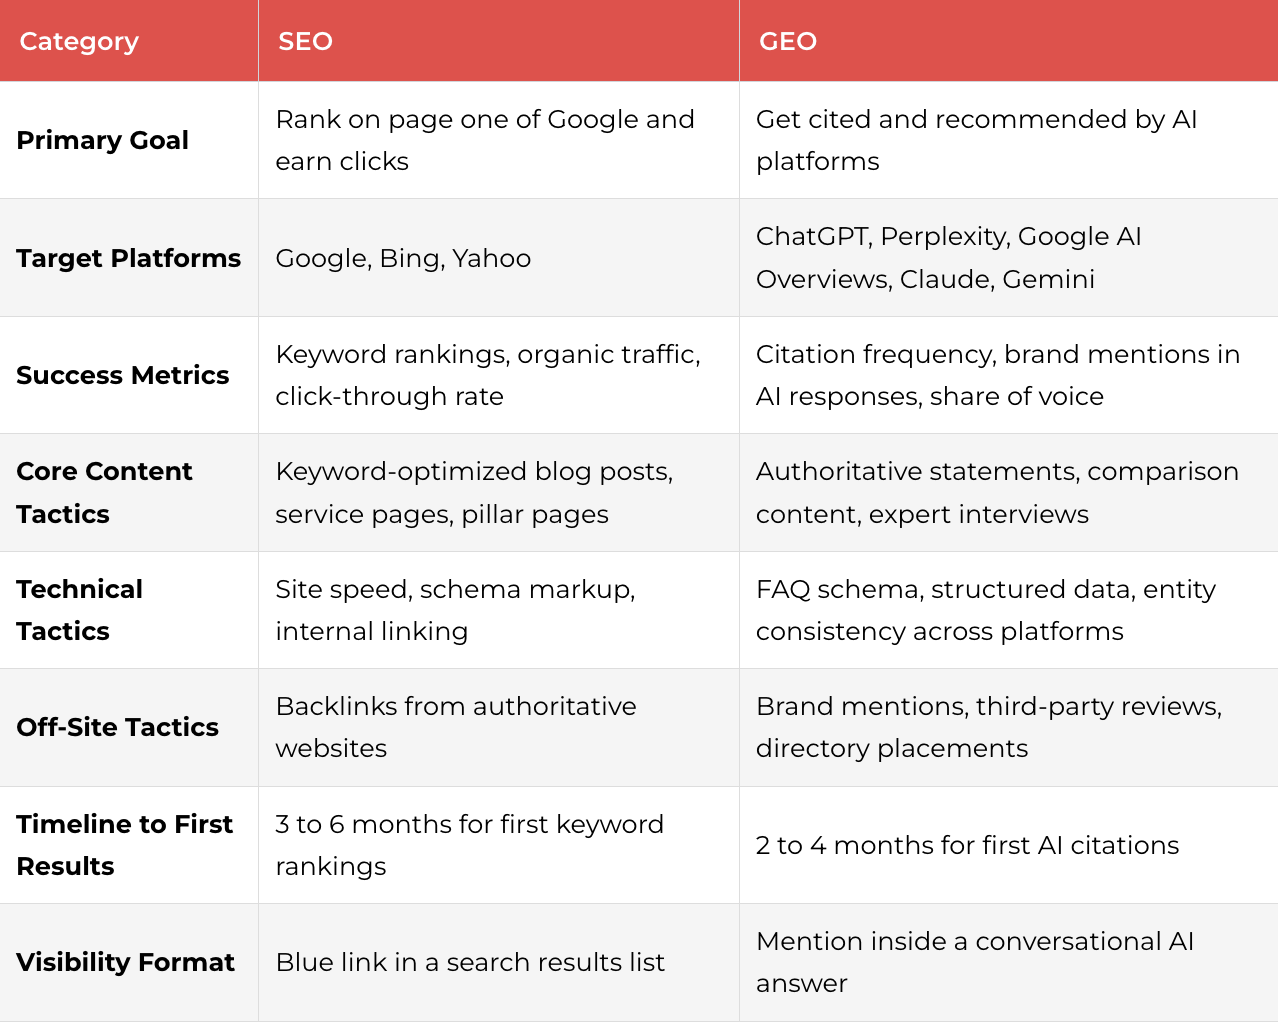
GEO vs. SEO: What Is the Difference for Local Businesses: 2026
Average AI Adoption Rate for Small Businesses: 2026
Sources
- Altus Marketing Research Study. Altus Marketing, New York, NY. June 2026.
- GoodFirms. “AI SEO Statistics 2026: 35+ Verified Stats & 9 Research Findings on SERP Visibility.” Jennifer Warren, GoodFirms. May 2026. https://www.goodfirms.co/resources/seo-statistics-ai-search-rankings-zero-click-trends
- Heroic Rankings. “Google AI Overview Statistics: 2026 Trends and Impact.” Stefan Cvetkovic, Heroic Rankings. 2026. https://heroicrankings.com/seo/managed/google-ai-overview-statistics-2026/
- Semrush. “26 AI SEO Statistics for 2026 + Insights They Reveal.” Semrush. 2026. https://www.semrush.com/blog/ai-seo-statistics/
- Digital Applied. “Zero-Click Search Statistics 2026: Complete Data Guide.” Digital Applied. 2026. https://www.digitalapplied.com/blog/zero-click-search-statistics-2026-complete-data
- GrowthPro AI. “23 AI Search Statistics Every Local Business Needs in 2026.” GrowthPro AI. May 2026. https://growthproai.com/ai-search-statistics-local-businesses-2026